Two Gigabits, One Vendor
We asked five vendors for 2-Gbit/s SAN switches, and only QLogic stepped up to the challenge. The good news: Performance is excellent
January 5, 2002

A new technology called 2-Gbit/s Fibre Channel emerged in 2001, promising speeds fast enough to deliver the Holy Grail of storage-area networking – real-time access to offsite data.
Vendors of SAN equipment eagerly lined up to support the new spec. It sounded promising, so Light Reading commissioned the independent lab Network Test Inc. to evaluate 2-Gbit/s fabric switches. Test equipment maker Spirent Communications contributed the testing kit and engineering support.
Coming in first: QLogic Corp.
Coming in last: QLogic Corp.
There's a Logic at work here. No fewer than five switch makers said they’d have equipment ready by year’s end.But when vendors actually had to submit equipment for testing, only one – QLogic Corp. (Nasdaq: QLGC) was willing to go through with it.
Some vendors said they just didn’t have the equipment or the people. One company – Vixel Corp. (Nasdaq: VIXL) – entered the test and then withdrew. The dominant player – Brocade Communications Systems Inc. (Nasdaq: BRCD) – simply said no.
Not a pretty picture, by any means. The most likely explanation is that – as with any new technology – there are still significant bugs to work out in these time-to-market products.
On the positive side, the fact that QLogic submitted its product meant that we were able to go ahead and perform the first ever public test of 2-Gbit/s FC technology. Not simply the first 2-Gbit/s switch test, mind you. Nor just the first 2-Gbit/s fabric test. It was first ever public 2 Gbit/s test, period.
What did we learn? The good news is that QLogic’s SANbox2 switches worked very, very well. The switches really do run at 2-Gbit/s or close to it. Better yet, the boxes posted the lowest latency numbers ever recorded in any test conducted by Network Test. About the only downside was some elevation in latency in our more advanced tests.
Table 1: Table for One
QLogic Corp. Aliso Viejo, California | |
Product and version tested | SANbox2, version 1.1 |
Maximum ports per switch/per cascade | 16/3,348 |
Switch architecture | Cross-connect |
Topologies supported | Point-to-point, arbitrated loop, switched fabric, cascade, mesh |
Traffic classes supported | 2, 3 |
Management methods | Telnet, serial, in- and out-of-band SNMP, Java-based Web application |
Management software support | Linux, Solaris, Windows 9x/Me/NT/2000 |
Redundant features | Power supplies, fans |
Price as tested | $17,500 |
It’s a promising start, at least for QLogic. Now it’s up to the other vendors to show they, too, can deliver working 2-Gbit/s solutions.
Read ahead for details:
Excuses, Excuses
Fibre Channel in a Nutshell
First Things First
Size Does Matter
Delay Tactics
Switch Jitters
Failsafe
Hold That Line
All for One
Various vendors had various reasons for not participating (see No Shows). But Brocade deserves special mention.
The 800-pound gorilla of SAN switches told us that yes, it did have 2-Gbit/s switches in the pipeline, but no, we couldn’t have any. The company’s CEO even told Light Reading founding editor Stephen Saunders that Brocade was “really busy” and suggested we follow up with one of the company’s OEM partners. We tried three – Hitachi Data Systems (HDS), IBM Corp. (NYSE: IBM), and Storage Technology Corp. (StorageTek) (NYSE: STK) – with no luck (see Brocade Balks at 2-Gbit/s Test -- Again for the gory details).
As difficult as dealings with Brocade sometimes became, the complete opposite could be said for QLogic. The vendor cheerfully offered constructive criticism of our test plan, worked long hours in prototyping the test, and even pointed out a few flaws in our procedures. We wish dealing with every vendor were this easy (see Now You See ‘em…).
One other thing: Apart from the numbers achieved by QLogic in the test, the vendor deserves enormous credit for its willingness to submit product for independent public review. Fortunately for QLogic, its switches really do run at 2 Gbit/s. Until they’re able to show independent proof to the contrary, the number for all the other switch makers is zero.
Fibre Channel has been around for more than a decade, but the technology only started selling in large quantities when it was applied in the late1990s to SAN gear like host-based adapters and fabric switches.
The arrival of serious money from large enterprises and ISPs that needed to ramp up their storage infrastructures brought with it requirements for high performance, flexible configurations, massive scaleability, and global manageability – all traits that Fibre Channel adherents say their technology offers.
As for speed, most Fibre Channel interfaces in production today run at 1 Gbit/s. That may be fast enough for some offsite backup or disaster recovery applications, but it’s not fast enough for real-time retrieval of offsite data.
“In the movie industry there are people who get $250,000 a year for their eyes,” says QLogic field engineer John Kaulen. “They can tell if there’s even a little hiccup in a film or video feed. We need technology that runs faster than they do.” Kaulen’s point applies not only to the entertainment industry, but also to any organization looking to store its data one place and use it somewhere else.
This points up another major driver for faster Fibre Channel: For applications involving massive data transfers, the pipe is never fat enough. Consider that some databases grew into the petabytes range years ago. Or that Wall Street firms send terabytes (or more) of data to back-office locations in New Jersey every night. For these applications, 2-Gbit/s Fibre Channel helps address the need for speed.
As for flexibility and scaleability, Fibre Channel supports multiple topologies and offers built-in QOS and flow control features. Among the supported topologies are arbitrated loop (support for up to 127 attachments per loop over distances of up to 10 kilometers) and switched fabrics, which extend available bandwidth as switches are added. Fibre Channel’s large number of supported attachments makes it a compelling technology. In contrast, most SCSI buses support just 8 or 16 attachments.
As for QOS and flow control, Fibre Channel offers connectionless and connection-oriented traffic classes, both with and without acknowledgements of data sent.Fibre Channel’s built-in flow control turned out to be a key factor in our tests. In Fibre Channel, a transmitting interface can’t put a frame on the wire until it receives a so-called buffer-to-buffer credit (BB credit). The scheme is intended to prevent receiving ports from becoming congested – but as our tests show, the BB credit scheme also can degrade throughput, latency, and jitter, even in the absence of congestion.
As in any switch test, we began with baseline measurements of three key metrics – throughput, latency, and jitter. These tests describe the basic forwarding and delay characteristics of the switches under test.
Actually, in a lab environment, “basic” is still pretty stressful. In these tests, we use Spirent’s SmartBits traffic analyzer/generators, equipped with the vendor’s new FBC-3602A 2-Gbit/s Fibre Channel cards and SmartFabric software, to offer traffic to every port, destined for all other ports, at line rate. This is a so-called “fully meshed” pattern.
Fibre Channel vendors told us that our pattern was highly stressful (that’s a compliment in the benchmarking world) but not necessarily representative of traffic patterns in production nets. Multiple vendors sent us sample traces showing that Fibre Channel frames tend to arrive in bursts. This differs from traffic passing through Ethernet, ATM, or Sonet switches, where successive frames may have arbitrary destinations.
To make our results more meaningful for Fibre Channel users, we configured the SmartBits to offer eight frames to each port with the same destination before changing destinations. We also conducted the same tests with a burst count of one, meaning we offered one frame to port A destined to port B, then offered one frame to port A destined to port C, and so on. We’ll refer to these patterns as one-frame and eight-frame bursts throughout this article.
Vendors and users also told us traffic consists primarily of two frame lengths – 60 and 2,148 bytes, the minimum and maximum in Fibre Channel. We conducted separate tests using each frame length.
Besides using two traffic patterns and two frame lengths, we also used two different physical setups – one with a single 16-port switch, and one with four 16-port switches connected by multiple interswitch links (see Test Methodology for diagrams of test bed topology).
So why are we going on at such length about configuration details? Because, it turns out, the size and complexity of the test bed have a marked effect on throughput, latency, and jitter.
Our first measurement examined throughput of 2,148-byte frames – the largest allowed in Fibre Channel, and thus theoretically the traffic that should deliver the highest throughput.
And that’s what we saw: In three out of four configurations, the Qlogic switches either ran at line rate – a perfect score – or came very close to it (see Figure 1). In the best case – one switch handling one-frame bursts – QLogic attained the maximum theoretical rate of 210.15 Mbyte/s. In the worst case – when we tested with four switches and used eight-frame bursts – throughput dropped to 170.78 Mbyte/s, around 81 percent of maximum.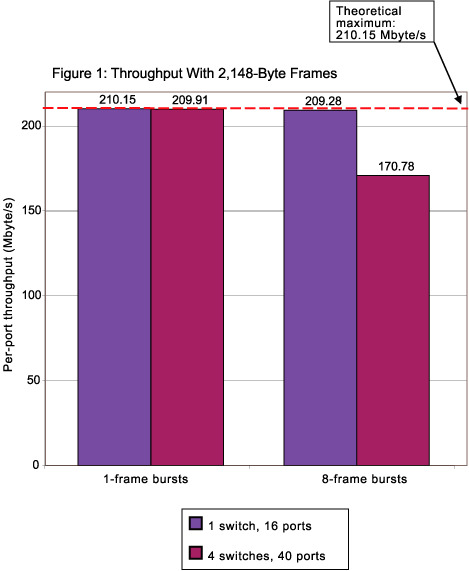 We were a bit surprised by the fact that throughput with eight-frame bursts is lower than with one-frame bursts. If anything, we’d expect longer bursts to give switches a chance to “catch their breath” between destinations, thus boosting throughput. QLogic attributes the dip to congestion on the interswitch links. After extensive study of the test patterns and results, QLogic’s engineers concluded that the reduced throughput was a function of different flows having different hop counts through the test bed – that is, different flows crossed different numbers of switches. Even though we presented frames to the switches at the same time, the hop-count differences would cause some frames to arrive later than others – with the corresponding drop in throughput.
Also, note that the maximum rate for user data is really 210.15 Mbyte/s, or around 1.681 Gbit/s. It’s not possible to fill a pipe with 2 Gbit/s worth of user data because the Fibre Channel protocol dictates that there must be at least 24 bytes (6 words) between frames.
By the way, Ethernet has a similar limitation – the minimum interframe gap – that prevents user data from traveling at the nominal line rate. Although the gap is far smaller with Ethernet, it’s not entirely fair to do direct comparisons since Ethernet is a best-effort technology (it attempts to send data as fast as it can), while Fibre Channel attempts to regulate rates with flow control.
The switches moved traffic noticeably more slowly when we offered 60-byte frames (see Figure 2). In this case, the switches moved traffic at the maximum rate in just one out of four configurations, and in the worst case – four switches and eight-frame bursts – moved traffic at just 79 percent of line rate. QLogic attributes the slowdown to congestion on the interswitch links.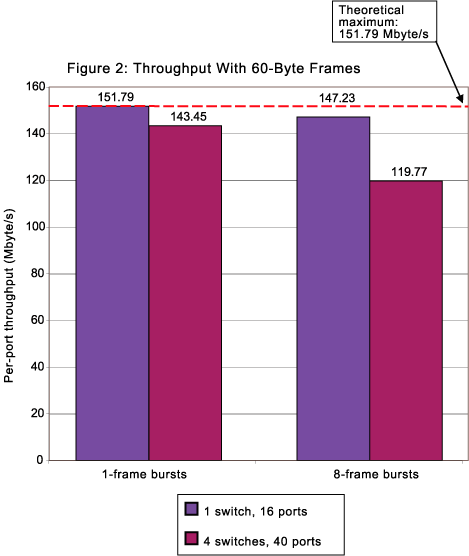 We should remind readers that no SAN carries traffic comprised exclusively of 60-byte frames. Although there are some transaction-processing applications on SANs that involve large numbers of small frames, our tests are intended only to describe the performance limits of the switches. Results for switches in production networks will most definitely differ – probably for the better.
Latency – the amount of delay added by a device – is at least as important a consideration as throughput.
In our tests, we examined minimum, average, and maximum latency in the same configurations as our forwarding tests. We also examined jitter – the amount of variation in latency.
In general, QLogic put up excellent latency numbers. With large frames, the highest average latency we recorded was just 600 nanoseconds – and even that worst-case number beats any latency number we’ve ever recorded in previous tests of other high-speed technologies (see Figure 3). Across a single switch, average latencies were just 400 nanoseconds. (That's not just fast, incidentally – that's incredibly fast. If you want a really good apples-to-oranges comparison, consider that a hummingbird beats its wings 20 times per second – or once every 50 milliseconds. Assuming 400ns latency, a QLogic switch can transmit 125,000 frames in the time it takes a hummingbird to flap its wings once). 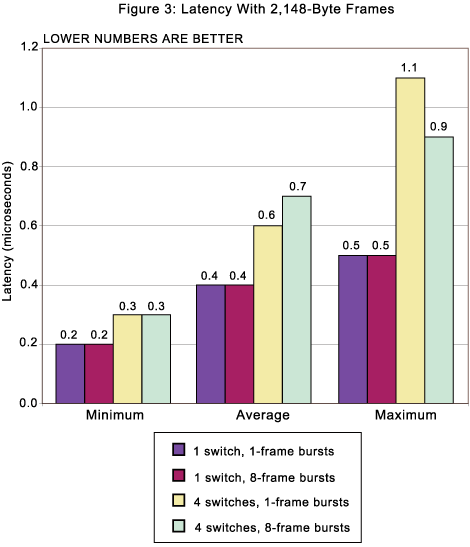 We observed similarly low latencies when the SANbox2 handled short frames (see Figure 4). Here again, the highest average latency we recorded – just 700 nanoseconds – is still around 10 times lower than any number we’ve previously seen in benchmarking switches in similar configurations with OC48 Sonet or gigabit Ethernet interfaces. For example, in a previous four-system test of core routers with OC48 (2.5 Gbit/s) and OC192 (10 Gbit/s) interfaces, the lowest average latency we recorded was around 15 microseconds, versus the nanosecond numbers for the SANbox2 (see Internet Core Router Test) Of course, the configurations in the two tests were somewhat different and thus cannot be directly compared; however, the differences in latency should give readers at least a rough sense of the vastly lower latency of the Fibre Channel switches.
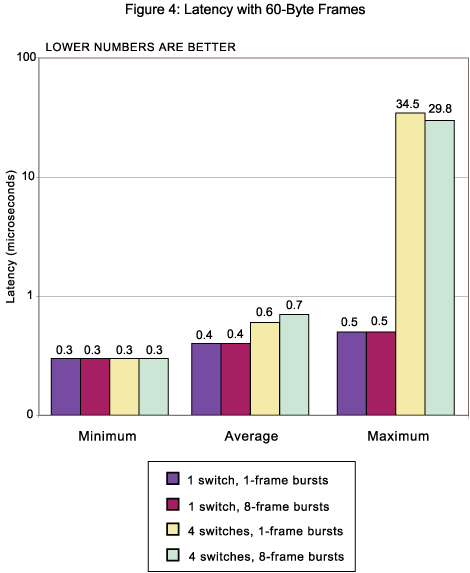 Why is Fibre Channel latency so much lower? The answer, in a word, is “cut-through.” Fibre Channel switches examine only a frame’s 24-byte header, not the entire frame, before forwarding the frame to its destination, a process called cut-through switching. Even for short frames, cut-through switching produces dramatically lower latency – and it’s roughly the same latency for short and long frames.
One problem we did note was that maximum latency jumped dramatically for short frames in our four-switch tests (see Figure 4, again). Maximum latency rose to 34.5 microseconds for one-frame bursts of short frames – high enough for us to present the results here on a logarithmic scale because a linear scale wouldn’t show the differences in other tests. As with the drop in throughput, QLogic again attributes the increase to different numbers of hops through the test bed, leading to some congestion on the inter-switch links.
It’s important to put the latency numbers in context by describing how much jitter, or latency variation, occurred.
By themselves, some of the maximum latency numbers look scary – in one case, the maximum is more than 57 times the average. But that doesn’t necessarily mean application performance will suffer. In our four-switch tests, we offered nearly 3 billion frames. If just one of those frames had relatively high latency, it would have set a high-water mark – but one that is actually statistically insignificant.
For some applications like voice, and especially video, jitter can be a better metric than latency because it shows how consistent a device’s delay is.
In the single-switch tests, jitter was a complete nonissue. In all tests, jitter was less than the 100-nanosecond timestamp resolution of the SmartBits analyzers. In the four-switch tests, jitter for long frames was less than 100 nanoseconds with one-frame bursts, and 100 nanoseconds with eight-frame bursts.
Jitter with short frames did jump appreciably in the four-switch tests, to 3.7 microseconds with one-frame bursts and 2.5 microseconds with eight-frame bursts. Both numbers are more than three times the latency measurement itself, but probably not a cause for alarm. Manufacturers of other technologies running at 2 Gbit/s and faster (like Sonet OC48 or OC192) would be very pleased to register jitter numbers like these.
Besides our baseline tests, we also performed a bevy of more advanced tests. These included measures of failover, congestion control, and handling of many-to-one and many-to-few traffic patterns.
For many SAN managers, downtime simply isn’t an option. This is especially true for providers of managed storage services, where 100 percent availability is a must-have.To handle this need for 24/7 availability of storage resources, many SAN designs use multiple interswitch links (ISLs) between switches. The idea is that if any single link or interface fails, there’s always a backup path available.
To determine how quickly traffic gets switched onto that backup path, we devised a test involving two chassis and two ISLs. We configured the SmartBits to offer traffic to the first switch at an aggregate rate of 1 million frames per second. With 128-byte frames, that rate is equivalent to about 71 percent utilization of a single 2-Gbit/s link, but the switches actually share the load across the two ISLs.
Then we physically remove one of the ISLs and note the drop in throughput. At some point, the switch will reroute traffic that had been using the first ISL onto the second ISL. Since we offer traffic at 1 million frames per second, each lost frame counts as 1 microsecond of cutover time.
We ran the test five times across the SANbox2 pair, and found average cutover time to be 181.6 microseconds, with a maximum of 228.0 microseconds.In the context of providers looking to offer customers subsecond failover times, these numbers are very small indeed. Tiny, actually. The numbers are also doubly impressive, considering that the threshold where application performance starts to suffer is usually measured in milliseconds, not microseconds.
Congestion is a fact of life in networking. Inevitably, on occasion, a switch will be handed two frames destined to the same output port at the same time. Since the switch can only forward one frame at a time, the other frame either gets buffered or, if congestion is severe enough, dropped. This is true even for flow-controlled technologies like Fibre Channel, where issues like clock drift and scheduling algorithms can still induce congestion. While congestion is unavoidable on any given port, it shouldn’t have any impact on other ports.
To determine how well a switch handles congestion, we used the head-of-line blocking test. The goal of this test is to determine if congestion on one interface will lead to performance degradation on other, uncongested interfaces.
This test involved just four interfaces on a single switch. We offered frames at line rate to interface A, all destined for interface B. At the same time we offered frames at 50 percent of line rate to interface C, again destined for interface B; thus, we presented interface B with a 150 percent overload. At the same time, we offered frames at 50 percent of line rate to interface C, but these frames were destined for interface D. Would performance suffer on this uncongested port?
No, it would not. With both 60- and 2,148-byte frames, the SANbox2 moved all the traffic destined to the uncongested port with no slowdown (see Figure 5). Better still, latency and jitter were virtually identical to the numbers in our single-switch baseline tests.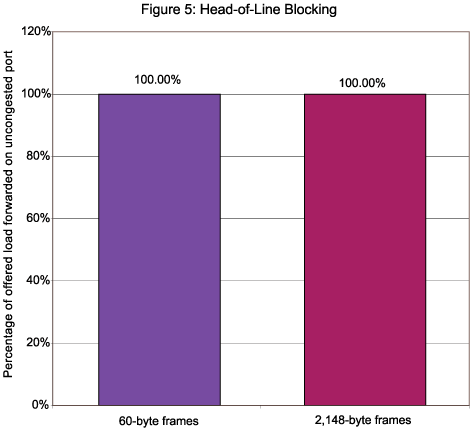 Of course, it’s better to avoid congestion wherever possible. But these numbers suggest than when (not if) congestion does occur on any one port, the SANbox2 won’t lead to suffering for traffic on other ports.
While our baseline tests describe the essential forwarding and latency characteristics of the QLogic switches, the results don’t necessarily predict how the switches will behave in production networks. QLogic – and other vendors – say traffic patterns on production nets typically don’t involve the full-mesh pattern we used in our baseline tests. Instead, they say, traffic patterns usually involve many hosts attempting to reach one or a few storage devices.
We modeled these patterns in our many-to-one and many-to-few tests. For the former, we offered traffic to 15 ports on a switch, all destined to the one remaining port. For the latter, we offered traffic to 12 ports, with destinations spread equally across the remaining four ports.
Of course, blasting away at 12 or 15 2-Gbit/s ports at full line rate would simply create a huge overload. We avoided this by configuring all the ingress switch ports at 1 Gbit/s instead of 2 Gbit/s, and then offering each just enough traffic that, when combined, it would completely fill the egress 2-Gbit/s interfaces at line rate. For example, in the many-to-one pattern we offered each of 15 ingress ports 1/15 of the 2-Gbit/s rate of the egress port.
Throughput was generally high, but not quite as high as in the baselines (see Figure 6). In no case did the switches forward traffic at the theoretical maximum rate, and in one case – 60-byte frames in the many-to-few pattern – traffic utilized 98.43 percent of available bandwidth. For the other configurations, throughput was within 1 percent of the maximum – in one case within 0.06 percent of line rate.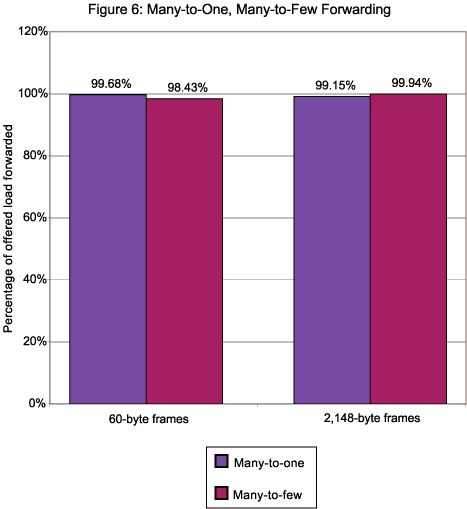 One possible explanation for the minor differences between line rate and the numbers achieved here is the fact that multiple ports’ traffic needed to be scheduled for output. At high load levels, delays induced by a switch’s scheduling algorithm could lead to a small amount of transient congestion. We’ve seen similar issues in previous tests involving many-to-one patterns.
While throughput was reasonably close to the baseline results, the latency numbers were very different (see Figure 7). With large frames – the kind most commonly found in SAN applications – average latencies shot up as high as 73.4 microseconds, nearly 200 times the best average latency in the baseline tests. 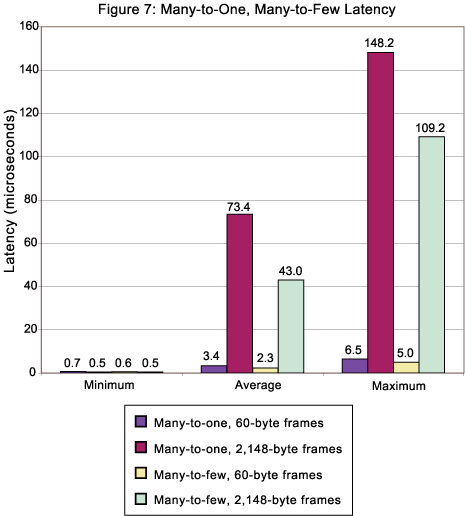 Here again, we attribute the increase in delay to the process of scheduling many input paths onto one output path. Even though Fibre Channel switches are cut-through devices, the entire frame must still be queued for output. That could explain why latency with large frames is so much higher than with short frames.
Whether the increased latency is significant is another matter. As noted, most applications’ performance won’t suffer until latency reaches up into the milliseconds. However, note that latency is cumulative, so these increases will grow with the number of switches in use. Further, small latency in the network doesn’t necessarily equate to small latency for the application. Remember that when a host receives a frame it must still pass it up the stack and on to the application. Certainly, the ideal when it comes to latency is to keep it low and constant.
Jitter in the many-to-one and many-to-few tests was similar in most cases to the numbers in the baseline tests – either negligible or smaller than the latency measurement. The only place where jitter represented a significant fraction of latency was in the many-to-few tests with 2,148-byte frames, where jitter was 30.4 microseconds, as opposed to 43.0 microseconds for latency.
David Newman is president of Network Test Inc. (Westlake Village, Calif.), an independent benchmarking and network design consultancy. His email address is [email protected]
You May Also Like


_International_Software_Products.jpeg?width=300&auto=webp&quality=80&disable=upscale)


