The largest, independent test of Cisco's service delivery network 1.9 million potential users In-line video quality monitoring Massive scalabilty of IP video services
June 3, 2009

This report series documents the results of a Cisco IP video infrastructure, applications, and data center test. Earlier this year, following months of talks with Cisco Systems Inc. (Nasdaq: CSCO), Light Reading commissioned the European Advanced Networking Test Center AG (EANTC) to conduct an independent test of a premium network solution to facilitate advanced IP video services for service providers, enterprises, and broadcasters alike.
It's an understatement, but we'll say it anyway: Carriers are concerned whether their service delivery networks will scale to the forecast exponential growth of video services.
In today’s competitive environment, both telcos and cable companies see the future as one IP-based network that helps to provide more flexible services. But those networks, however operationally complex, need to be manageable. And these companies need to support advanced IP video services, specifically meeting broadcaster, consumer, and enterprise requirements for HD video distribution.
So it's no wonder service providers are so tough on telecom equipment makers. And it's no wonder that some telecom equipment makers are choosing to lead the discussion on IP video, rather than waiting for their customers to ask for tomorrow's network today.
The zettabyte diet
Cisco Systems Inc. (Nasdaq: CSCO) has been spreading the zettabyte-era gospel since mid 2008. If one network-based application could really drive traffic towards the zetta mark (1 sextillion bytes), IP video would be everyone’s first bet. And these days the term “IP video” has moved on from a basic walled-garden IPTV idea to a fairly open concept.
Hulu LLC , for example, just launched an over-the-top desktop application, while Boxee is gaining ground, and AT&T Inc. (NYSE: T)'s U-verse service is delivering the Masters Tournament to its subscribers on three screens. For Cisco this must all sound great – service providers require more bandwidth in their core and aggregation networks, universal broadband access coverage, and more routers and switches out of the factory. (See Cisco: Video Will Be Half of IP Traffic by 2012, Hulu Launches Desktop App, and AT&T Delivers Three-Screen Masters Coverage .)
Cisco's Medianets
As it has shown in the past, Cisco understands the implications of bandwidth explosion both in the residential and in the enterprise world. In the latter, Cisco is already considered a fixture but it has not been resting on its laurels. Cisco has been busy adding enterprise-focused applications such as telepresence, video surveillance over IP, and digital signage to its arsenal. Cisco has described its IP, media-aware infrastructure initiative using the term "medianet" since December 2008. The company’s CEO, John Chambers, put his full force behind the story. (See Cisco's Video Blitz and How Cisco Does It.)
So Cisco has a point in analyzing the market and coming up with a marketing strategy that matches the needs of service providers. But how much of the story can it actually deliver today? Was there a chance Cisco would be ready to submit equipment and support for a test of Medianet?
The Megatest
Actually, Cisco welcomed the idea – quickly realizing, however, that this effort would be monumental compared to any equipment test ever published in a magazine in our business before. A six-month program was installed; fifteen business units got involved; Cisco’s senior vice president for central development organization backed the project; and it quickly adopted the name “Megatest” until the team converged on the more realistic name of “Über Megatest."
In an unprecedented testing campaign, European Advanced Networking Test Center AG (EANTC) was commissioned by Light Reading to investigate all of a medianet’s aspects: We started from Cisco’s network infrastructure supporting enterprise and residential customers as well as a purpose-built network for broadcasters. We then moved on to the comfort of the end-user’s home and looked at the applications Cisco says it can bring to the market. And we closed with a focused investigation into Cisco’s service provider data center solutions, which we will cover in a separate special report next week.
The tests covered the following main areas:
High availability with sub-second failover time for all network services
In-line video quality monitoring
Massive scalability of IP video services
Storage area network solutions and virtualization
In addition, we received extensive demonstrations from Cisco showing both residential and enterprise applications. These will be documented in the next article in this series, coming later this week.
Results snapshot
In short, Cisco’s medianet solution showed excellent results:
8,188 multicast groups were replicated across 240 egress ports in a point of presence (PoP), showing that Cisco could serve 1.96 million IP video subscribers in a single metro PoP.
Accurate in-line video monitoring was demonstrated for video distribution and contribution over IP.
Sub-50 millisecond failover and recovery times were shown for video distribution and secondary distribution networks using, for the first time in a public test of Cisco equipment, point-to-multipoint RSVP-TE.
No video quality degradation in the face of realistic packet loss in the network
Excellent quality of service (QoS) enforcement in Cisco’s new ASR 9010 router for both fabric oversubscription and head-of-line blocking
Hitless control plane failover for converged network
In the world’s first test of this breadth and width, Light Reading and EANTC have found that IP infrastructure from Cisco really does deliver. This is the first in a three-part report series wherein Light Reading and EANTC will share these groundbreaking results.
In this report, we cover Cisco's medianet service delivery network. Here's a hyperlinked table of contents:
Page 2: Setting Up the Test
Page 3: The Service Delivery Network
Page 5: The IP Video Network
Page 12: Video Contribution Networks
Page 15: Secondary Distribution Networks
Page 18: Conclusions
— Carsten Rossenhövel is Managing Director of the European Advanced Networking Test Center AG (EANTC) , an independent test lab in Berlin. EANTC offers vendor-neutral network test facilities for manufacturers, service providers, and enterprises. He heads EANTC's manufacturer testing, certification group, and interoperability test events. Carsten has over 15 years of experience in data networks and testing. His areas of expertise include Multiprotocol Label Switching (MPLS), Carrier Ethernet, Triple Play, and Mobile Backhaul.
— Jambi Ganbar is a Project Manager at EANTC. He is responsible for the execution of projects in the areas of Triple Play, Carrier Ethernet, Mobile Backhaul, and EANTC's interoperability events.Prior to EANTC, Jambi worked as a network engineer for MCI's vBNS and on the research staff of caida.org.
— Jonathan Morin is a Senior Test Engineer at EANTC, focusing both on proof-of-concept and interop test scenarios involving core and aggregation technologies. Jonathan previously worked for the UNH-IOL.
Next Page: Setting Up the Test
Can Cisco deliver a premium network solution to facilitate advanced IP video services?
To find the answer, we started our investigation where we left off in our 2007 Cisco IPTV independent test report – Testing Cisco's IPTV Infrastructure – and expanded it to create three types of networks: video contribution, secondary distribution, and a converged network serving residential and enterprise customers.
Cisco brought to the test its arsenal of routers: the CRS-1 core router (which we've also tested before – see 40-Gig Router Test Results), the recently announced ASR9010 for aggregation, and the 7600 for the DSL- and cable network-facing service edge.
In the 2007 edition of the test, we had already base-lined the standard routing, quality-of-service, failover, and multicast tests, so we avoided repeating them. It would have been nice to baseline everything again just to make sure the latest hardware and software does not fall behind previous versions, but, honestly speaking, we did not make friends with Cisco by being pedantic like an incumbent operator. So one could argue that the baseline tests are missing for newer Cisco equipment – the ASR 9010, specifically, as the world has not seen full-feature support in any independent public test yet. Let’s say we leave these tests to the reader as an exercise.
Looking to the future
While in previous Light Reading tests we insisted on using only production-grade code, we allowed Cisco to put beta software and "first look" hardware to the test in some cases this time. All test results achieved with such configurations are clearly marked throughout the report. The rationale was that having a glimpse into the near future seemed worthwhile. We know that Tier 1 operators have already started testing these products earlier this year. Future-proofing the IP video network and services provides a competitive advantage:In most markets worldwide, consumers and enterprises are only a phone call away from switching to another service provider. The revenue per triple-play consumer or enterprise video customer is higher than for the average broadband Internet-only customer, so it is important to win such customers with superior technology.
Video subscribers are accustomed to a certain level of service as traditionally provided by the cable or satellite TV providers. It is ironic that some operators have to guarantee more stringent QoS and resilience to triple-play consumers nowadays than they were ready to offer to enterprise customers a while back.
We selected the tests of Cisco’s IP video transport solution for this report to validate the solution’s flexibility, scalability, in-line monitoring, and resiliency when dealing with IP video applications.
EANTC test requirements
Throughout our testing, we enforced one major EANTC requirement: realism. Before accepting a test, it had to be well understood what its applicability would be to a real service provider network designed according to the vendor’s best practices. Could a reader answer the questions: "Why is this test important for my business case?" and "How can I use the results?" Once this was understood, we got to work designing the test traffic to be used in order to create authentic network characteristics.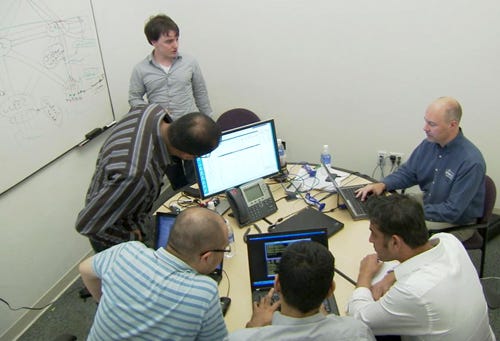
Logistics
This test was Cisco’s most complex and realistic public testing effort in 2009 and probably ever. Formal testing took only two weeks in April and May, but it was preceded by an extensive Cisco preparation phase that started in November 2008. A large amount of effort was given to coordinating all the product groups and business units involved in the test. More than eight of Cisco’s carrier-class routing and switching products were involved in the service delivery network testing – some of them brand new and unannounced at the time of preparation. It took Cisco a little while to firm up the detailed network architecture fitting all the different components. The result was worth it, and we were able to match the network design requirements a modern, cutting-edge service provider would expect to see.
Test rules
Third-party testing is bound to face scrutiny and be subject to the questions of critical readers, and all for good reason. It is with this in mind that EANTC defined a set of testing rules before the project proceeded. First, we agreed that EANTC control the test plan. Cisco professionally agreed to follow the independent test guidelines, and the final decision was always held by EANTC.
We also divided the responsibilities strictly between EANTC and testing vendor Spirent Communications plc , on one hand, and Cisco on the other. EANTC and Spirent were to operate all testing hardware and auxiliary devices (such as wire-monitoring, or impairment devices) while Cisco was to configure the complete network under test, including any Cisco components, and, if needed, troubleshoot any problems found in the network while testing.
Once testing started, EANTC changed all passwords in the network and maintained control of the devices. We logged CLI output and captured the configuration files for each of the tests and every element within the test. Given the complexity and the number of tests executed, we ended up with a good amount of Cisco configuration files for Cisco’s three primary operating systems: IOS, IOS XR, and NX-OS.
Next Page: The Service Delivery Network
The Medianet service delivery network was designed by a group of Cisco engineers to support a set of advanced video applications such as telepresence and high-definition IP video services, in addition to residential and business services like voice over IP (VoIP) and high-speed Internet access. Cisco expanded on the IPTV network designed and tested in 2007, added the new ASR 9010 as an aggregation router, and it introduced a data center, fully adorned by Cisco’s Nexus product family members – the Nexus 5000 and the 7000.
All services emulated in the network, except video on demand (V0D) and pay-per-view (PPV) movies, terminated on one of the three data center devices, a design we keep seeing in service provider deployment scenarios. The data center was directly connected to the network core, where native IP traffic was injected into IP/MPLS tunnels for all unicast services. All links in the network were Ethernet-based. The IP/Multiprotocol Label Switching (MPLS) network included a core backbone of two CRS-1 routers and an aggregation network made up of two ASR 9010 routers (where VoD services were terminated) and two 7609-S routers. All unicast user services were delivered through RSVP-TE tunnels while native IP transport and Protocol Independent Multicast Source Specific Mode (PIM-SSM – specified in RFC 4607) enabled multicast connectivity for broadcast and PPV video.
In several of the tests presented in this article, specifically in tests that addressed video distribution and contribution, a subset of the network topology was used. These changes are described in the appropriate sections.
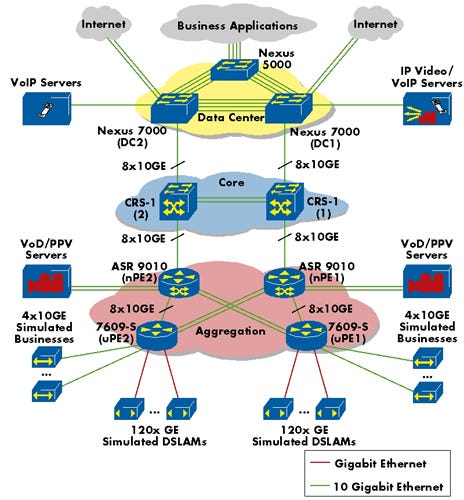
Each of the two CRS-1s was installed with two distributed route processors (DRPs) on which two Secure Domain Routers (SDRs) were configured. In effect, every physical CRS-1 was partitioned into two independent virtual routers. Cisco’s engineers configured one SDR to serve business customers, while the second supported the residential customers. Cisco explained that this configuration allows service providers tighter control of the different service types. As Cisco engineers said, different service-level agreements (SLAs) are more traditionally signed with business customers than with residential subscribers, thus allowing service providers to build high resiliency for very tight SLAs while relaxing the requirements on best-effort services.
At EANTC, we increasingly find quite strict (internal) service-level requirements for consumer video because nobody can afford packet loss in triple-play environments, so we were not completely sure about Cisco’s explanation. In addition, the amount of control plane traffic at the CRS-1 did not seem to be huge: From the network design perspective, one route processor should have been able to handle it, as Light Reading and EANTC found already five years ago. (See Cisco's CRS-1 Passes Our Test.) So Cisco’s exercise seemed, first and foremost, a clever way to show it can master the complexity of DRPs – which certainly have a very good reason for existence in other scenarios.
Each user-facing provider edge (uPE) device had four 10-Gigabit Ethernet interfaces for business services and 120 Gigabit Ethernet interfaces for residential services. With two uPEs in the network, this came to a total of eight 10-Gigabit Ethernet ports and 240 Gigabit Ethernet customer-facing ports – a hefty load. There have been a number of humongous test scenarios published recently. At closer look, however, they were just packet blasting without any advanced services in place. We challenge other vendors to combine such packet blasting with advanced services and the level of complexity verified in this test.
All customer-facing interfaces were configured according to Cisco best practice with QoS policies, and each service was operating within its own VLAN (one VLAN per service type in the network).
Next Page: Emulating Network Services & Users
We used five Spirent TestCenter chassis SPT-9000A to emulate all Medianet services. For some of the tests we used the TestCenter in Layer 2-3 mode, emulating massive amount of flows and applications; but for some of the tests, where real video was required, we made use of the Spirent TestCenter Layer 4-7 application.
Each of the 240 uPE residential ports was a Spirent TestCenter port, emulating an IP DSLAM behind which all residential services were received. Of course, regarding the business-facing ports, it is far from typical for a provider to bring a 10-Gigabit Ethernet link straight to an enterprise customer’s premises, so using the TestCenter we implemented Cisco’s suggestion to emulate a series of downstream routers behind each of the eight uPE business ports. These emulated routers built an Open Shortest Path First (OSPF) topology and used OSPF to advertise the business user routes to the uPE.
Table 1: Number of Spirent TestCenter PortsService
Ports
Port Type
DSLAMs
240
Gigabit Ethernet
Business Ports
8
10 Gigabit Ethernet
VOD and PPV
4
10 Gigabit Ethernet
Internet
4
10 Gigabit Ethernet
Voice and IP Video
2
10 Gigabit Ethernet
Telepresence
2
10 Gigabit Ethernet
Digital Signage
1
10 Gigabit Ethernet
IP Video Surveillance
1
10 Gigabit Ethernet
Source: EANTC
Below are links to diagrams showing the traffic breakdowns for each emulated DSLAM port in the test, followed by tables showing the backbone traffic expectations and a breakdown of the number of emulated users:
Table 2: Backbone Traffic ExpectationsService Type
Residential Traffic
Business Traffic
Aggregated (Traffic Downstream)
Aggregated Traffic (Upstream)
IP Video (720p and 1080p)
600 Mbit/s unidirectional
None
600 Mbit/s
None (only IGMP joins)
PPV (1080p)
80 Mbit/s unidirectional
None
80 Mbit/s
None (only IGMP joins)
VOD (720p and 1080p)
38.4 Gbit/s bidirectional
None
38.4 Gbit/s
None
VoIP
3.456 Gbit/s bidirectional
2.6624 Gbit/s bidirectional
6.1184 Gbit/s
6.1184 Gbit/s
Internet
19.584 Gbit/s bidirectional
19.6 Gbit/s bidirectional
39.184 Gbit/s
39.184 Gbit/s
Digital Signage
None
1.04 Gbit/s bidirectional
1.04 Gbit/s
None
IP Video Surveillance
None
9.6 Gbit/s bidirectional
9.6 Gbit/s
9.6 Gbit/s
Telepresence
None
15.6 Gbit/s bidirectional
15.6 Gbit/s
15.6 Gbit/s
Total
110.6224 Gbit/s
70.5024 Gbit/s
Source: EANTC
Table 3: Total Number of Emulated UsersNetwork Service
Service Description
Total Number of Concurrent Users Per Port
Number User Ports
Number of Emulated Hosts
IP Video
IP Video 720p
200 Channels
240
48,000*
IP Video 1080p
50 Channels
240
12,000*
VoIP
Residential
225
240
54,000
Video on Demand
Pay Per View
20 Programs
240
4,800*
Video on Demand 720p
40
240
9,600
Video on Demand 1080p
20
240
4,800
Internet
Internet (Residential)
225
240
54,000
Residential Users Summary
187,200
Business Applications
Digital Signage
1,300
8
10,400
IP Video Surveillance
2,600
8
20,800
Telepresence
390
8
3,120
VoIP
5,200
8
41,600
Internet (Business)
3,150
8
25,200
Business Users Summary
101,120
Source: EANTC
* based on the number of IGMP "joins" (one per channel per port)
Next Page: IP Video & VoD
Most RFPs from Tier 1 providers today consider video applications of some sort in their requirements. The basic IPTV service has made significant progress since 2007 and is deployed in many networks today. IPTV traditionally refers to a residential service providing broadcast TV channels to consumers over a broadband connection. Some providers are still holding off on large-scale IPTV deployments due to questions about transport network scalability (especially when considering high-definition video) and, frankly, they're finding it hard to justify the business case. We will deal with the second aspect in the second report in this series. For now, let’s focus on the challenges in transport technology.
Programming note: For the remainder of the report we will use the term "IP video," which embodies the evolution this solution makes from basic IPTV.
Residential video
The residential services used for the test included:200 IP High-Definition Video (720p) channels at 2 Mbit/s
50 IP High-Definition Video (1080p) channels at 4 Mbit/s
Video on Demand (both at 720p and 1080p) at 2 Mbit/s and 4 Mbit/s, respectively
Pay per View (1080p) at 4 Mbit/s
Video-driven enterprise services
Enterprise video applications consisted of a slew of new offerings from Cisco to help monetize an increase of service to enterprise customers. These new applications are:Telepresence. Allows members of a team from around the world to see and hear each other as if they were physically in the same room. High-definition screens display your colleagues in great detail as they are sitting in their respective conference rooms, while VoIP conference services that we are familiar with are integrated into the solution.
Digital signage. Introduces new methods of marketing to your customers. Businesses can deploy screens wherever they wish – lobbies, waiting rooms, cafeterias, public offices, football stadiums – and publish marketing content to the screen through the network without being required to physically visit the location. (See IPTV Scores at Cowboys Stadium.)
IP video surveillance. Provides a significant upgrade to this legacy security mechanism, allowing for additional flexibility and increased quality. Surveillance video can be observed by anyone in the network, rather than being restricted to a designated room.
High-speed Internet and VoIP services
In addition to the advanced services as described above, standard Internet access and voice over IP were also supported by the network and verified in the test. For VoIP traffic we used 64 kbit/s per emulated voice call. Internet traffic was emulated using a combination of dominant frame sizes, mixed according to findings reported by the Cooperative Association for Internet Data Analysis (CAIDA) 's packet size distribution report.
Next Page: Results: Multicast Group Scalability (IP Video Network)
Key findings:Cisco's 7600 routers replicated 8,188 multicast groups, or channels, across 240 egress ports in a point of presence (PoP).
This test aimed to find the maximum number of users that could simultaneously be viewing an IP video channel.
Cisco's 7609-S multicast implementation showed it could serve nearly 2 million IP video subscribers from a single metro PoP.
Broadcast service scalability is an important concern for any service provider offering IP video services. A service provider’s investment in its network equipment must be protected over a certain amount of time – normally around five years or more. This means that, as more residential customers subscribe to the IP video service, the network must support more and more set-top boxes and, by extension, more clients asking for IP multicast streams.
IP multicast uses the concept of "groups" to determine which subscribers join a multicast stream using the Internet Group Membership Protocol (IGMP), specified in RFC 3376. The third version of the protocol, IGMPv3, was used in this test. A group could be considered analogous to a TV channel – one group would broadcast HBO while the other transmits the video and audio stream for Fox News. Therefore, when a viewer is sitting at home in front of the TV and clicking on the remote control to surf across channels, he or she is sending IGMP messages asking for multicast groups.
In this test, we aimed to measure the scalability of the network, to find the maximum number of users that could simultaneously be viewing an IP video channel. Multicast streams are replicated at each node in the network only when necessary, ensuring that only a single copy of a stream is sent across each link. Therefore the multicast distribution is most challenging at the receiving end – the user provider edge (uPE). In order to scale to a large number of viewers per access node port, we had to reduce the bandwidth per emulated video stream to an artificial value of 0.12 Mbit/s. This was the only way to reach the final number of video channels we wanted to test, using Gigabit Ethernet egress interfaces.
Another prerequisite to make it possible to test at this scale was disabling all non-IP multicast traffic in the network. Multicast traffic was going to use every available capacity of the user-facing ports, leaving no room for other traffic. The purpose of this test was to find the maximum limit for multicast activity supported in theory, to evaluate the headroom available in hardware – both in terms of channel changing activity as well as number of channels supported.
To run the test we configured the Spirent TestCenter port, which emulated the video headend in test topology to source 8,188 multicast groups – a monumental increase from its original 250 groups. We then sent IGMP "joins" from each of the 240 emulated DSLAM ports at 50 packets per second up to the respective 7609-S routers. Once all joins had been sent, we started traffic for all groups simultaneously. Good times. Traffic was configured to run for 30 minutes – a realistic run time when considering the length of many sitcoms. During the test we used the Spirent TestCenter to measure maximum jitter, average jitter, maximum latency, and minimum latency.
Table 4: Multicast Group ScalabilityResults
Min (microseconds, amongst the 240 ports)
Max (microseconds, amongst the 240 ports)
Maximum Jitter
28.73
38.99
Average Jitter
3.519
3.66
Maximum Latency
218.25
230
Minimum Latency
141.43
132.36
Source: EANTC
Assuming a scenario with no multicast-aware devices between the 7609-S routers and the user set-top-boxes, and assuming each user had joined a different channel amongst the 8,188 on offer, the results showed that Cisco’s network presented for the test could scale to a theoretical number of 1,965,120 video subscribers per metro aggregation network (that is, per pair of 7609-S routers).
This way, the 7609-S router multicast hardware scales much higher than typical IPTV broadcast implementations would require. Video codecs available today use 1 Mbit/s to 2 Mbit/s per standard-definition stream. With these, and background Internet traffic running in parallel, only around 5 to 10 percent of the maximum multicast capacity of the 7609-S will be needed using Gigabit Ethernet egress interfaces, which is equal to 50,000 to 100,000 video subscribers per 7609-S router.
Anyway, the Cisco 7609-S multicast implementation excelled in the test and showed scalability beyond any imaginable consumer broadcast video requirements. The table above shows the minimum and maximum values across the 240 receiver ports for: maximum jitter, average jitter, maximum latency, and minimum latency as reported by the Spirent TestCenter. The effective unidirectional downstream multicast throughput we measured was a little more than 119 Gbit/s per router, or 992.8 Mbit/s per egress Gigabit Ethernet port.
Next Page: Results: Control Plane Failover (IP Video Network)
Key findings:EANTC simulated control plane failure in routers that were forwarding a full profile of Medianet traffic.
We were able to observe hitless failure and restoration across all the routers tested.
The test shows that end users wouldn't likely be affected by a control plane failure on Cisco's routers.
Resiliency mechanisms are required as part of service provider best practices. Especially within the core and the aggregation layers of the network, we see focus on complete 1:1 resiliency – link, node, and control plane – within triple-play networks. Having a redundant control plane means that if a software or hardware issue occurs in the router, recovery would be possible without inflicting any negative impact on the end users – in our case, both residential and enterprise customers. We'll say it again: Having a redundant control plane means that if a software or hardware issue occurs… oh, you get the idea.
In this test we simulated control plane failure by physically removing the active Route Processor (RP, Cisco’s name for its control plane unit) from some of the router types in the test network while the system was forwarding traffic. For traffic we used, again, the full Medianet traffic profile. We recorded the number of frames lost during the failure (if any) and monitored the system for stability once the secondary RP replaced the failed RP. The test was performed on the CRS-1 with both the RP and the Distributed Route Processor (DRP) and with the ASR 9010. We did not conduct the test with the 7600 router.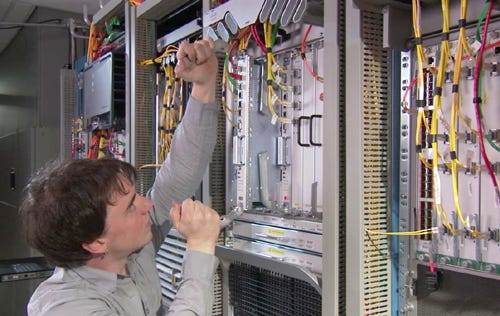
We first ran traffic for two minutes, during which the card with the active RP was removed. We then ran traffic for a longer period of time while we re-inserted the card and waited for it to fully boot and indicate that it was in a standby state. For the CRS-1, we ran this phase of traffic for 10 minutes, because its cards take more time to boot, and five minutes for the ASR 9010. We repeated this procedure three times in total for each device under test. This included the CRS-1 RP, the CRS-1 DRP, and the ASR 9010 RP. When we ran the second repetition of each test, we would pull a different card from the first and third repetitions, since the first repetition left a new card to be the active card. Got all that? Good.
Throughout all test runs we observed hitless failure and restoration, meaning zero packets lost, with the exception of one ASR 9010 RP insertion test run where a single packet was dropped. The Cisco engineer who re-inserted the card explained that the loss was due to the manner in which the card was re-inserted. [Ed. note: What'd you do? Get a running start?] For this reason we conducted a fourth test run where, after inserting the card correctly, we witnessed zero packet loss. With these results we are confident that a control plan failure on one of such Cisco routers would not induce a negative impact on the end user.
Next Page: Results: Lossless Video (IP Video Network)
Key findings:Cisco’s Digital Content Management (DCM) MPEG Processor was able to identify and fix network video streams before the end user sees them.
Our tests showed that if a link in one of the DCM 9900’s data paths fails, the end user will not experience discontinuity in his TV viewing.
Networks that transport IP video signals are very sensitive to frame loss. If a single MPEG I-frame is lost, and no loss concealment algorithms are running on the decoder, the viewer could easily see artifacts (blotchy, messed-up pixels) on the TV. The test idea presented by Cisco was simple: Send two copies of each broadcast TV channel across the network. In a network that has diverse paths, the loss of frames in one stream should not cause loss in the other stream. Cisco’s Digital Content Management (DCM) MPEG Processor positioned at both the transmission and the receiving ends of the network would then be able to identify frames lost from one stream and inject frames from the healthy stream before the broadcast stream leaves the network. And there you have it: In theory, the user will see no impact on the video quality even if loss is seen in the network.
Still, that is in theory. In order to test the feature, we used the Spirent TestCenter Layer 4-7 software to source an MPEG-4 (H.264) video file, which was streamed over an MPEG transport stream. Twenty-five groups were created, each configured to host the MPEG file individually. One tester port was connected to a DCM 9900 device upstream in the data center, while the receiving tester port was connected to a second DCM 9900 device downstream in the aggregation area (connected to uPE2). The data center DCM 9900 had two physical connections into the network, one to each Nexus 7000, so each copy of the video stream could take a different path in the network. At the receive side we used the Video Quality Assurance tool in Spirent’s software to detect loss on the MPEG stream via the continuity errors.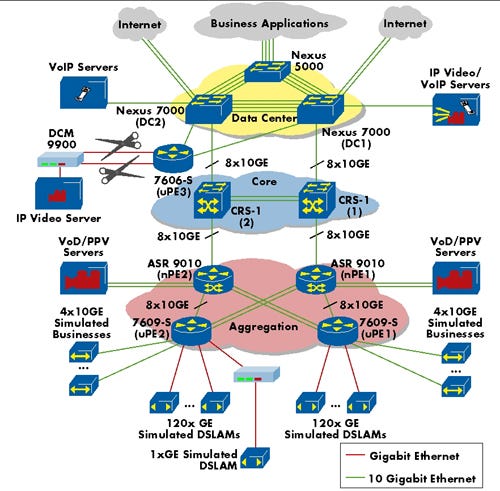 To begin the test we started the full Medianet traffic profile so we could verify that the DCM 9900 functionality was compatible with the Medianet solution. This traffic was still configured on Spirent TestCenter hardware and software. Once the Medianet traffic was running we started the MPEG traffic hosted behind the DCM 9900 device. The MPEG traffic ran for 40 seconds. While all traffic was running, we disconnected one of the cables giving the data center DCM 9900 network connectivity, and plugged it back in. Once traffic stopped, we would run the test again, now disconnecting the opposite cable providing the DCM 9900 network connectivity. This procedure was repeated three times in total.
After each test run, we observed the loss in Medianet traffic and the continuity errors for the MPEG traffic. Throughout all three test runs we experienced zero loss in Medianet traffic, which proves that the DCM 9900 setup did not induce negative effects on the Medianet solution. All tests also showed zero continuity errors on all 25 video streams. This proves that if a link in one of the DCM 9900’s data paths fails, regardless of which of the two paths, the end user’s MPEG decoder will not experience any discontinuity in her video.
Next Page: Results: Mixed Class Throughput – ASR 9010 (Product Tests)
Key finding:A standalone test of the ASR 9010 shows that the router is capable of delivering 160 Gbit/s of multicast and unicast traffic, or 80 Gbit/s in each direction per slot.
IP video product tests
We started our exploration of the Medianet solution by focusing a few tests on single components. While the solution as a whole provides a comprehensive media delivery platform, we knew that individual components could safely be tested as standalone units for specific test cases. In all these individual test cases we kept the Medianet use firm in the foreground and used relevant and realistic traffic profiles to perform the tests in the context of Medianet. Two media delivery network elements that fell into the single component test category are the Cisco ONS 15454 with Xponder cards and the Cisco ASR 9010 with eight ports of 10-Gigabit Ethernet linecards.
Results: Mixed Class Throughput – ASR 9010
A key element in the Medianet design is the ASR 9010, which was only announced at the end of last year – a fresh target for our testing. Of the two existing models, we looked at the bigger one, the ASR 9010. The ASR was positioned in the Medianet topology as an aggregation router between Cisco’s 7600s that were connected to the users and the core routers – the CRS-1s. Amongst the many features announced by Cisco, one of the highlights is the throughput performance. We were excited to test Cisco’s advertised claim for 80 Gbit/s of bidirectional throughput for mixed multicast and unicast traffic. For this reason we conducted a single device test in addition to the Medianet solution testing to verify the throughput capacity labeled on this device.
LR and EANTC had a first look at a linecard with eight 10-Gigabit Ethernet ports, which we were told will be released as A9K-8T-E. The tests were based on the Internet Engineering Task Force (IETF) Request For Comments (RFC) 3918, with slight modifications – we adopted the RFC’s "Mixed Class Throughput" to the Medianet test context.
IP video traffic is transported using packets that pack as many MPEG packets as possible into IP. Hence, small IP packets, so small that not a single MPEG packet could fit inside of them, are largely useless in our context. We therefore settled on testing a range of realistic frame sizes, aiming at video delivery, ranging from 1280 to 1518 bytes. Other than this change to frame sizes, the methodology described in the RFC was followed. A multicast-to-unicast ratio of 3:7 was used, since multicast traffic generally uses a small piece of the pie; however, we still wanted to test the case of a portion as large as 30 percent.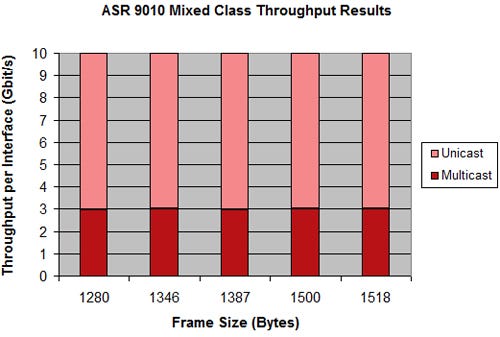 The RFC states the result as the highest rate at which frames weren’t dropped. With the goal of line rate in mind, we only transmitted traffic at line rate. Thankfully, the stepping down of rate could be avoided, because no frames were lost at any of the tested frame sizes. This shows that the device could handle delivering 160 Gbit/s of multicast and unicast traffic or 80 Gbit/s in each direction.
For a more general overview of the ASR 9000 Series capabilities, have a look at this custom video LRTV shot for Cisco at Light Reading's Ethernet Expo event in London earlier this year:Next Page: Results: Quality of Service – ASR 9010 (Product Tests)
Key finding:The ASR 9010 was able to deliver high-priority traffic, such as VoIP calls, even when the network was under an unusual traffic load and fending off a simulated denial-of-service attack.
The aggregation nodes in the service delivery network could experience congestion under several conditions. Since most, if not all, residential networks are statistically multiplexed, there is always a risk that an application would see an overnight success and the bandwidth facing the users would be consumed more rapidly than new capacity could be installed in the network.
Additionally, in case a linecard fails on the aggregation node, the remaining linecards would have to carry the load towards the users. A third scenario is a distributed denial-of-service (DDoS) attack. Such attacks could cause a network to experience extreme congestion, but the service provider would still be expected to provide premium services regardless. That is, in fact, what we consumers pay them for.
For this test, we had two goals. First, show an extreme oversubscription scenario that in essence will oversubscribe the router’s fabric – the internal interface between the linecards and the control plane. The second goal: To add to the above oversubscription from another source linecard, one that should not suffer due to the congestion that already exists.
In both test scenarios Cisco’s engineers configured the device under test (DUT) to protect two traffic classes: enterprise and residential VoIP, and broadcast video that consisted of IP video and PPV traffic flows. Cisco’s engineers said the two traffic classes could be protected in our scenario, which meant that all other applications could potentially be adversely affected when congestion occurs in the network. As most of the traffic in the Medianet topology was flowing southwards, towards the users, we emulated our congestion scenarios on the interfaces facing the uPEs. The two congestion scenarios were simulated according to the following logic:Additional PPV video streams are added in the network in order to scale the VoD service offering. At this stage there is no congestion in the network; the interfaces facing the users on the aggregation nodes are running at 94 percent. After this increase of traffic we simulated a DDoS attack on the residential users sending an additional 32 Gbit/s of traffic in the southwards direction. This translated to additional 8 Gbit/s of best-effort IP traffic on each egress interface on the congestion linecard. In essence, at this point the whole linecard was receiving slightly more than 69 Gbit/s of traffic, which it had to process on four 10 Gbit/s interfaces – not a doable job for any linecard.
The second congestion scenario involved adding additional traffic streams from another linecard with two different egress points – our congested linecard described above, and another uPE-facing linecard.
In both test cases we followed the same procedure: first verifying that the regular Medianet traffic was being transported without any frame loss, then adding the pay-per-view video streams, verifying again that no frame loss or increase in latency or jitter were recorded in the test topology. We added the traffic streams that were used to congest the router, only when we were satisfied that no frame loss or change in latency or jitter was recorded in the network. Then we recorded the frame loss and any changes to latency or jitter that was incurred due to congestion.
In both test cases Cisco claimed that the high-priority traffic streams – the IP video and VoIP – would see no adverse affect, while all other traffic streams traversing the router were fair game for frame loss and latency increase.
Our results for both test cases matched Cisco’s claims. When using the first oversubscription scenario, we recorded frame drop in all affected streams apart from the high-priority traffic. For these flows that were not affected, we also recorded microseconds increase in latency – from 37.02 microseconds to 112 microseconds for multicast, and from 12.23 microseconds to 72 microseconds for VoIP traffic. In the second oversubscription scenario we expected traffic to be dropped from one linecard, but not from the second, and indeed we recorded just that.
Next Page: Results: ONS 15454 With Xponder Resiliency (Product Tests)
Key findings:The ONS 15454's Xponder tune-up has the old Sonet battleship fighting a more nimble war of Ethernet aggregation.
The Xponder card proved to be resilient, with the maximum out-of-service time for each network service type we tested less than 31 milliseconds.
When we first heard from Cisco that they intend to use the ONS 15454 as part of the Medianet solution we were puzzled. As far as we knew, the ONS 15454 is a transport network solution traditionally used in SDH/Synchronous Optical Network (Sonet) networks. We then discovered that using a newly introduced interface card for the 15454, the Xponder, is an optical switch that turns the transport solution into an Ethernet aggregation solution. (See Cisco Shows Some Optical Love and Cisco Enhances Optical.)
This move extended the life of already deployed 15454s, giving service providers another use for the same old box. The interfaces facing the network remain the same – Dense Wavelength-Division Multiplexing (DWDM) – while the interfaces facing the customers on the Xponder interfaces are pure Ethernet. As part of the Medianet solution, the 15454 could be used to aggregate residential customers, enterprises, or both, and transport the corresponding traffic to the respective uPE device where Layer 2 services would be terminated.
While we could have easily spent a week testing the Layer 2 capabilities of the Xponder interface, we focused a single test on a requirement we hear from many of our service provider customers: resiliency. Cisco claimed that the 15454 system with the Xponder interfaces could guarantee a maximum out-of-service time of 50 milliseconds in the case of a link failover. We put the claim to the test within the Medianet context. We took the Medianet traffic profile and shrank it down to 10-Gigabit Ethernet ports to include all residential and all enterprise services.
In order to ensure that the behavior of the device is consistent, we repeated the failover test cycle three times. The first part of each cycle consisted of running test traffic, and measuring the out-of-service duration of each service when the primary link between two 15454 boxes was broken. The second half of the cycle used the same procedure, but measured the out-of-service time per application when the primary link was reinserted and the system began to use it for traffic. The diagram below shows the out-of-service times for each service within each failure cycle.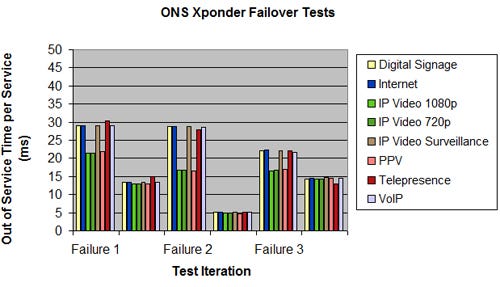 Since the 15454 system could potentially aggregate enterprise customers, residential customers, or a hybrid of both, all network service types were used for the test.
Due to there being 10-Gigabit Ethernet customer-facing ports observing the out-of-service times, the values in the graph are an average amongst the 10 ports. One observation: The three multicast-based services recovered consistently better than unicast services. The worst observed failure was 30.29 milliseconds for the enterprise telepresence service. But, overall, the tests successfully proved that out-of-service times were consistently below 50 milliseconds.
Next Page: Video Contribution Networks
Video contribution networks are designed with one goal in mind: to transport large, uncompressed, video signals from one location to another. For example, during the Olympic games in China, many national networks were receiving live high-definition feeds directly from the games to editing rooms. These feeds were than spliced, enhanced with tickers and ads, and then compressed and sent further to the viewers.
The transmission of uncompressed, unencrypted digital video signal is specified in a set of standards defined by the Society of Motion Picture and Television Engineers (SMPTE) for Serial Digital Interface (SDI). As the Medianet traffic profile called for high-definition traffic, we used Internet Protocol (IP)/UDP (User Datagram Protocol)/RTP (Real-Time Protocol) traffic streams, which simulated SDI-to-IP converters. We used 2.97-Gbit/s streams for each video source.
Table 5: Video Contribution TestSource Ports
Receiving Ports
2x SDI emulated streams (2 multicast groups) at 2.97 Gbit/s each
1 port on each router
3x SDI emulated streams (3 multicast groups) at 2.97 Gbit/s each
1 port on each router
Source: EANTC
Cisco provided a purpose-built network for this set of tests. The network consisted of a combination of CRS-1s and 7600s, as is shown in the figure below: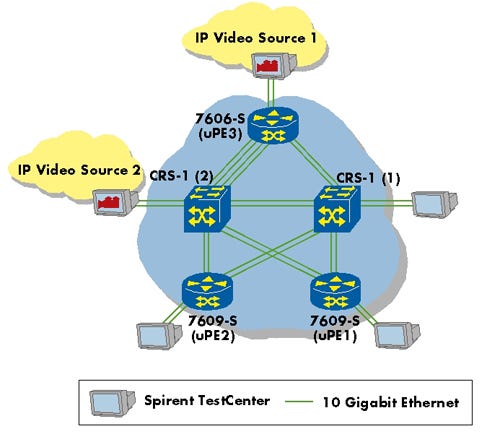 The big difference between the Medianet network configuration and this test (other than the obvious lack of ASR 9010) was the fundamental transport mechanism used for carrying the uncompressed video over IP streams from its source to the various receiving video editing rooms. Cisco used point-to-multipoint (P2MP) RSVP-TE (RFC 4875) to transport the multicast groups. The benefit of using RSVP-TE to transport multicast traffic is the ability to use the Fast Reroute mechanisms defined within the protocol.
Note: The operating system used in both router types was engineering level and is not available for download. We were told by Cisco that the code tested here is targeted to be released in December 2009.
Now that we've set the scene, the next page begins this test's series of results.
Next Page: Results: Link Failure (Video Contribution Networks)
Key finding:Cisco's 7606-S and CRS-1 routers, using production code that will be available in December, should both be able to reroute uncompressed, high-definition video traffic in less than 50 milliseconds, in the case of a physical link failure.
Those who are familiar with digital video transmission, especially uncompressed HD video transmission, are quite familiar with how brutal a blow loss can be to video traffic. This highlights the importance of fast recovery from failure. Our goal in this test was to verify Cisco’s claim that its point-to-multipoint RSVP-TE Fast Reroute solution could reroute emulated SDI video traffic in less than 50 milliseconds.
We performed this test under two scenarios – one with the 7606-S (uPE3) as the ingress router, and one with the CRS-1 (CRS-1-2) as the ingress router. Each time the same video distribution traffic profile was used, but the respective ingress and egress interfaces were swapped. After several rounds of discussion regarding how to simulate the failure of a physical link in order to trigger reroute, we settled on manually removing the cable, just as we have performed such tests in the past. We removed the fiber cable to simulate failure, and reinserted the cable to simulate recovery, all the while sending test traffic using Spirent TestCenter. In both tests we used the tester to count the number of dropped frames and calculated the out-of-service time based on that value. We performed three failover tests and three recovery tests for each device under test (DUT).
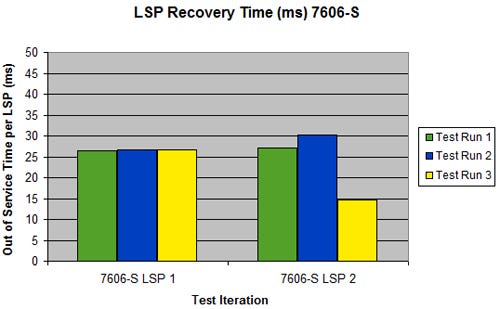
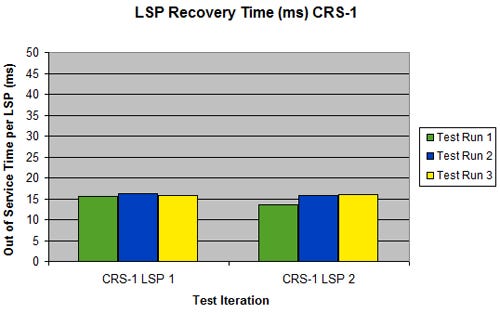 The results show the highest label switched path (LSP) failure times to be 30.2 milliseconds during the 7606-S tests and 16.2 milliseconds during the CRS-1 tests. This corresponded to a highest out-of-service time experienced by the user for a single video stream during the 7606-S tests to be 30.3 milliseconds and for the CRS-1 to be 16.2 milliseconds. After replacing the removed cable we used the Cisco CLI to observe that traffic indeed switched back to the primary path. No frames were lost during the restoration phase of the test.
The results were reassuring: When the code is finally available to the public, video distribution networks based on Cisco 7600-S or CRS-1 routers should be able to enjoy link failure recovery time of less than 50 milliseconds. And until that point arrives? Native IP multicast will continue being the transport mechanism for uncompressed video distribution traffic and, with it, higher out-of-service times.
Next Page: Results: In-Line Traffic Monitoring (Video Contribution Networks)
Key finding:Cisco's 7606-S routers do have the ability to detect and report on impaired video streams using Cisco VidMon at up to 40 Gbit/s per slot.
The difference between the video distribution network and a modern next-gen network is the former's dedication to servicing a single type of network traffic: uncompressed video. Service provider concerns for such a network are also different. Indeed, video distribution network operators are focused on the health of the service delivery of the uncompressed video – a bit more focused, than, say the service provider that delivers a compressed MPEG residential IP video service. It was with this in mind that Cisco implemented a new feature to monitor the video streams themselves. Two metrics were available on the 7609-S routers to monitor the constant bit rate (CBR) IP streams consisting of uncompressed video traffic. The two metrics were as follows:Media Rate Variation (MRV) – The percent by which the video stream is varying from the configured expected constant bit rate (CBR). MRV = (actual rate – expected rate) / expected rate.
Delay Factor (DF) – Some may find this term familiar from RFC 4445, which specifies Media Delivery Index (MDI). However, since the video traffic in this test was uncompressed, there was no MPEG header on which to perform MDI measurements. Cisco explained that the meaning of this DF metric changes depending on whether or not there is loss in the network, showing the “max cumulative jitter in microseconds” when there are no lost video packets, and the “cumulative max-packet-inter-arrival-time-variation in microseconds” when there are lost packets.
Both metrics were made over a configured interval of 30 seconds. When the interval is complete, a value gets added to the log, which can be viewed directly on the router’s command line interface (CLI). Currently no management system supports the polling of this information, so we used the CLI output to conduct the test.
We used two setups in this test. Test Setup A was used to verify that the monitoring could recognize that some streams were affected, and some not. To do this, the receiving TestCenter ports requested both the video streams we knew would be impaired and also the streams we knew would be left unharmed. These group choices were made based on the information we received from Cisco, and verified by the test.
Test Setup B was used to verify that the monitoring could be done on all streams in parallel, in which the TestCenter only joined impaired video streams.
While Spirent TestCenter was used to generate and receive traffic at the endpoints of the network, we used a Spirent XGEM Network Impairment Emulator to induce the impairments we expected Cisco’s 7609-S to detect and report. Two separate tests were conducted, one for each metric on the 7609-S, each using an impairment profile to verify the particular metric under test. Since the MRV metric is effectively used to detect loss, we first created a profile in which the XGEM would uniformly drop 5 frames out of every 10,000. Since this equates to 0.05% loss in traffic, this is the value we expected to appear on the CLI of the Cisco routers. The impairment profile was based on ITU-T G.1050, which defines expectable network conditions for different types of networks so that an impairment tool may replicate them. Due to the video requirements of video distribution networks “Profile A” metrics were used. To run the test, we first sent the appropriate IGMP joins from the TestCenter, which was dependent on which Test Setup we were using. We then started the traffic. We watched, by repeating CLI commands, as the Cisco routers initialized their monitoring tools – this happens once the streams are started. Once the CLI showed two baseline 30-second intervals, we enabled the loss profile.
Now we waited for a few minutes, so the router could print at least three 30-second MRV measurement values to the log. In some cases we allowed more intervals to print, in case we were slow to return from collecting the much-needed caffeine from the coffee room. We then disabled the loss profile on the XGEM. The intervals during which we enabled, or disabled, the loss profile were ignored, since the time needed to perform this human task was not quantifiable. We repeated the last steps of enabling and disabling impairment two more times for each Test Setup before stopping traffic, so we had three runs.
While we look forward to the management system, which can poll the measurements from the routers, we found the CLI output of the routers to be logical and readable. That said, it was not a simple task to crunch all the numbers when analyzing the results, since the 7609-S routers were configured to print an MRV and DF value for each 30-second interval (with an interval history configured to 20 in our case), under each multicast group, within each egress interface. Since the results were consistent among runs, we are able to shorten the data we display for you here. Here we show a sample of one interface out of the four, for one run of the three:
Table 6: MRV Results Test Setup
232.0.1.1 | 232.0.1.26 | 232.0.1.27 | ||||
Interval | Cisco MRV | Cisco DF (microseconds) | Cisco MRV | Cisco DF (microseconds) | Cisco MRV | Cisco DF (microseconds) |
113 | -0.00002 | 20 | 0 | 19 | 0 | 19 |
114 | -0.00002 | 20 | 0 | 20 | 0 | 19 |
115 | -0.00002 | 20 | -0.00004 | 25 | -0.00004 | 26 |
116 | -0.00002 | 20 | -0.00049 | 28 | -0.0005 | 31 |
117 | -0.00002 | 20 | -0.00049 | 29 | -0.0005 | 29 |
118 | -0.00002 | 20 | -0.00049 | 28 | -0.0005 | 29 |
119 | -0.00002 | 20 | -0.0005 | 30 | -0.00049 | 27 |
120 | -0.00002 | 20 | -0.0005 | 29 | -0.0005 | 30 |
121 | -0.00002 | 20 | -0.0005 | 30 | -0.00049 | 31 |
122 | -0.00002 | 20 | -0.00007 | 29 | -0.00007 | 28 |
123 | -0.00002 | 20 | 0 | 20 | 0 | 21 |
124 | -0.00002 | 20 | 0 | 20 | 0 | 20 |
Source: EANTC |
The table shows the values as they appeared on one interface from the 7609-S uPE1 CLI. This includes all three groups joined – two impaired and one left untouched – and all relevant intervals used for the test. Intervals 113-114 and 123-124 took place before and after, respectively, the impairment profile was enabled and therefore show a 0 or negligible MRV value for all groups. Intervals 116-121 show an MRV equal to or approaching 0.05% as expected for the two groups that were impaired, and a negligible MRV for the group that was not impaired. The non-zero negligible value indicates a constant slight difference of rate from what was configured in the router.
As expected, egress interfaces on uPE3 and uPE2 printed a 0 or negligible MRV value for all groups. Tests for Test Setup B showed similar results, with the difference that all groups on all interfaces showed an MRV between 0.049% and 0.051%.
As we moved on to testing the DF metric we used a similar procedure – however this time, instead of inducing loss with the XGEM, we induced jitter. The XGEM was configured to induce delays ranging from 75 milliseconds to 125 milliseconds, with a max per-packet delta of 10 milliseconds. The delay variance was configured for a “periodic” (Gaussian) distribution. Since the DF value was explained to indicate the maximum jitter value within the 30-second interval, we used the “Max Jitter” value on the TestCenter to compare with the router and verify that the latter was doing its job.
Naturally, the Spirent TestCenter value would be increasing for some time, quickly at first then gradually as the XGEM impairments fulfill their range, so we manually cleared the TestCenter counters as soon as a new Cisco interval started. Then, 30 seconds later, the Max Jitter value from the TestCenter was captured and compared with the freshly printed interval on the router’s log. This induces a small level of human error to be kept in mind when observing the results, but was small enough for us to still expect the results to be directly correlated. This manual action also explains the jump in spread of which intervals were monitored.
Table 7: Delay Factor Test Run
Video Streams Without Impairment (232.0.1.1-232.0.1.2) | Impaired Video Stream (232.0.1.26) | Impaired Video Stream (232.0.1.27) | ||||
Interval | uPE1 Interface | Cisco DF (microseconds) | Spirent Max Jitter (microseconds) | Cisco DF (microseconds) | Spirent Max Jitter (microseconds) | Cisco DF (microseconds) |
174 | 4/3 | 19 | 17.8 | 19,009.00 | 17,695.06 | 18,507.00 |
201 | 4/2 | 19 | 17.8 | 19,222.00 | 18,867.01 | 19,222.00 |
237 | 4/2 | 19 | 19.02 | 19,202.00 | 19,336.10 | 19,163.00 |
243 | 4/3 | 19 | 19.02 | 18,758.00 | 18,847.44 | 19,145.00 |
256 | 4/1 | 20 | 17.8 | 19,184.00 | 18,476.39 | 19,067.00 |
263 | 4/4 | 20 | 19.02 | 18,853.00 | 19,041.36 | 18,875.00 |
Source: EANTC |
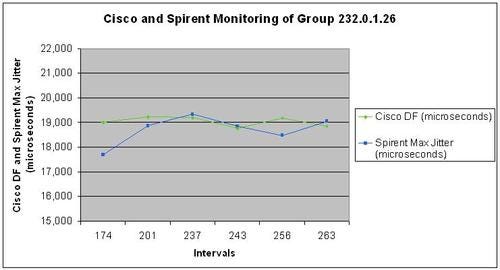 The table shows a sample including all intervals we monitored and compared with the Spirent TestCenter “Max Jitter” metric, all runs of Test Setup A. The results are a close correlation between the Cisco and Spirent values. With the exception of intervals 174 and 201, all values are within a 1-millisecond range of each other. Test Setup B also showed strong correlation between the Cisco and Spirent values.
Additionally a third setup (Test Setup C) was configured to use 2.375-Gbit/s video stream flows instead of the SDI-defined 2.97 Gbit/s, in order to fill the bandwidth of the egress interfaces by joining four video streams (groups) instead of three. Even under this full line-rate load, the measurements were accurate and agreed with Spirent TestCenter’s statistics.
Next Page: Secondary Distribution Networks
Similar to the Video Distribution networks, Cisco explained that it is seeing demand for a different type of network, which is also dedicated to the distribution of video traffic. However, these networks are dedicated for servicing MPEG-encoded traffic and are called Secondary Distribution Networks. Cisco proposed two network topologies, one built using PIM-SSM (Protocol Independent Multicast-Source Specific Multicast), and one built using point-to-multipoint RSVP-TE for these tests.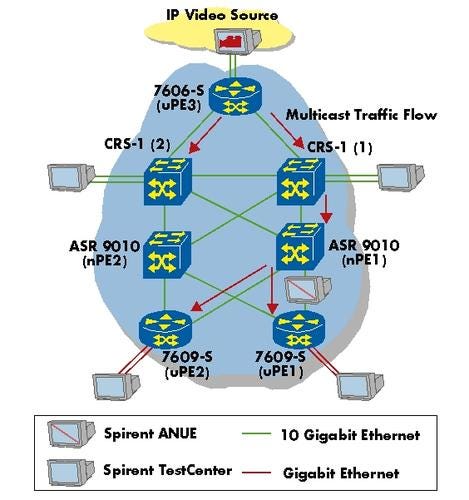
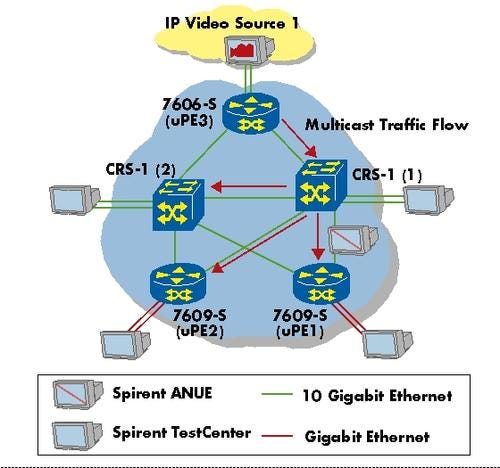 We defined a traffic profile for these tests, which consisted of 50 multicast groups, or video streams – half of which would egress one interface and half the other, on each CRS-1 as well as uPE1 and uPE2. The main focus of this group of tests was in-line video quality monitoring. As opposed to the uncompressed video monitoring, which in essence analyzed IP traffic, here MPEG headers were available in the traffic streams, and Cisco’s edge router – the 7600 – was able to report on the quality of the video. We used real MPEG Transport Streams (MPEG-TS) hosted and analyzed by the Spirent TestCenter Layer 4-7 software, while for the Link Failure test we “replayed” the same streams with Spirent TestCenter software.
Table 8: Secondary Distribution Traffic Profile
Source Ports | Receiving Ports |
25x MPEG-2 (emulated or real) at 5 Mbit/s each (25 groups) | 1 port on each router |
25x MPEG-2 (emulated or real) at 5 Mbit/s each (25 groups) | 1 port on each router |
Source: EANTC |
Next Page: Results: In-Line Video Quality Monitoring (Secondary Distribution Networks)
Key finding:
Cisco's 7600 routers were able to accurately report on MPEG compressed video quality degradation over PIM-SSM and point-to-multipoint RSVP-TE topologies.
Just as video monitoring is a helpful tool for video contribution networks, it comes in handy for operators running secondary distribution networks to be able to monitor their MPEG-level video quality. The monitoring capability allows, in theory, the operator to accurately identify streams that are experiencing transport-based issues. Nonetheless, the viewer is still going to receive an impaired stream to his or her TV. According to Cisco, VidMon is an MPEG-level Media Loss Rate (MLR) and Delay Factor (DF) monitoring tool, both of which are specified in "A Proposed Media Delivery Index (MDI)" – RFC 4445. In this test we verified Cisco’s Media Loss Rate (MLR) metric since Cisco stated that the delay factor (DF) measurements are no different than the DF metric used for the in-line video monitoring test we performed in the video contribution test area.
Cisco explained that the MLR, as defined in the RFC, is a count of discontinuity events in the MPEG transport stream header. This count could increment due to either lost or reordered packets. After some discussion with both Cisco and Spirent, we all agreed that the “Continuity Error” metric reported by Spirent’s Video Quality Assurance tool (VQA) should be comparable to Cisco’s VidMon MLR metric. While Spirent cites the ETSI standard TR 101 209, both metrics are an indication of MPEG-TS continuity.
As an additional aspect of the test, we ran the full test procedure over two network topologies: one using PIM-SSM for multicast distribution, and one based on point-to-multipoint RSVP-TE. The key difference is the missing pair of ASR 9010s in the point-to-multipoint RSVP-TE topology. The reason is that point-to-multipoint RSVP-TE is not yet supported for the ASR 9010.
In order to induce continuity errors to be counted by the Cisco 7609-S routers and Spirent TestCenter, we used Spirent’s XGEM Network Impairment Emulator to induce loss. A loss profile of every 5 packets uniformly chosen out of every 10,000 was configured on the XGEM, equating to 0.05% loss.
We expected the routers to report on MPEG-level continuity errors. This meant that when a single IP packet was lost, up to seven MPEG packets could be lost. This is due to the fact that several MPEG packets are normally carrier within a single IP packet. The same Secondary Distribution traffic profile was configured, all joins were sent, and traffic was started. After at least two clean intervals showing zero MLR values, we activated the loss profile on the impairment generator. We then allowed for at least three non-zero MLR values to print, after which we disabled the impairment. Once some 0 MLR values printed again, we stopped traffic. At the end of the test we had plenty of results – both from Spirent's Video Quality Assurance software and Cisco's routers – and now we were off to verify how accurate the results reported by Cisco were.
Table 9: MLR Results � PIM-SSM Topology
Total uPE1 Card 3 MLR Values (Groups 1-25) | Total Spirent Continuity Errors (Groups 1-25) | Difference (Groups 1-25) | Total uPE1 Card 2 MLR Values (Groups 26-50) | Total Spirent Continuity Errors (Groups 26-50) | Difference (Groups 26-50) | |
Run1 | 1139 | 1141 | 2 | 1181 | 1183 | 2 |
Run2 | 972 | 973 | 1 | 935 | 924 | 11 |
Run3 | 1279 | 1279 | 0 | 1273 | 1274 | 1 |
Source: EANTC |
Table 10: MLR Results � P2MP RSVP-TE Topology
Total uPE1 Card 3 MLR Values (Groups 1-25) | Total Spirent Continuity Errors (Groups 1-25) | Difference (Groups 1-25) | Total uPE1 Card 2 MLR Values (Groups 26-50) | Total Spirent Continuity Errors (Groups 26-50) | Difference (Groups 26-50) | |
Run1 | 947 | 948 | 1 | 931 | 931 | 0 |
Run2 | 1083 | 1096 | 13 | 1085 | 1082 | 3 |
Run3 | 1286 | 1284 | 2 | 1331 | 1329 | 2 |
Source: EANTC |
We quickly drowned in monitoring data collected by the routers, which was an expected consequence of the lack of a data aggregation and management system in the test bed. Since we received a first look at a new software solution not available for customers yet, we understand there is more work upcoming to integrate VidMon into a full solution. Cisco did not disclose its plans for a management application, or the exact road map, to Light Reading at this early point in product development.
We were pleased to see that the metric reported directly by the Cisco router was very close to the Spirent monitoring read-outs. Assuming, as we should, that by the time the code becomes public Cisco will integrate the statistics with its network monitoring tool, we clearly see benefits for IP video operators. Imagine being able to collect all the data about the operations of your multicast transported IP video channels, regardless of the transport mechanism, and be able to pin-point when the service was unacceptable, or when the viewer lost frames. Another wild idea could, of course, be tying MPEG delivery to SLAs, perhaps not for residential services but for other, higher revenue-potential services, and being able to back up your SLAs with accurate and reliable network-based monitoring. This would truly open the door for new revenue possibilities.
Next Page: Results: Link Failure (Secondary Distribution Networks)
Key finding:
In our test configuration, Cisco's routers were able to reroute secondary distribution network video traffic in less than 50 milliseconds when a physical link failure occured.
Similar to Video Distribution networks, the end users of Secondary Distribution networks will observe frame loss immediately – the video quality will be impaired. Link protection technologies are a big deal regardless of the form in which video content is transported. Our goal in this test was to verify Cisco’s claim that using its point-to-multipoint RSVP-TE Fast Reroute solution could reroute MPEG compressed video traffic in fewer than 50 milliseconds.
We performed this test using the Secondary Distribution traffic profile over point-to-multipoint RSVP-TE topology. We manually removed the fiber cable to measure failover times, and reinserted the cable to measure recovery times. For both tests we performed the manual cable action while running traffic, then counted how many frames were lost, to calculate the out-of-service time. We performed three failover tests and three recovery tests for each DUT.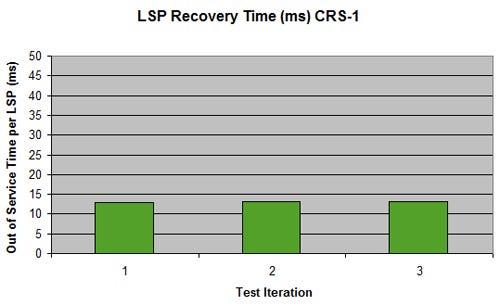 The results show the highest label-switched path (LSP) failure times to be 13.18 milliseconds, with a very consistent data spread. After replacing the removed cable, we used the Cisco CLI to observe that traffic indeed switched back to the primary path. The restoration test runs showed the system under test dropped zero packets.
Next Page: Conclusions
The tests show that Cisco’s next-generation IP infrastructure is a capable and advanced platform. The solution offers 50-millisecond failure recovery times for the dedicated video contribution networks used by broadcasters. And it offers the ability to serve more than 1.9 million residential IP video subscribers within a single metro region for service providers' hybrid residential-enterprise networks.
Cisco used the opportunity to showcase its new flagship router – the ASR 9010. The router, although just recently announced, already showed its power in a multicast and unicast throughput test in which 80-Gbit/s bi-directional traffic (160 Gbit/s in total) was achieved through a single linecard. As can be seen throughout the test, the ASR 9010 supports a subset of the most important hardware and software options of the 7600 router family already, exceeding the 7600 in some key hardware performance aspects, and making it a worthwhile prospect when it becomes generally available.
Given the strong competition in the IP video market, Cisco opted to use engineering software in some of the tests (where clearly marked) to show off specific new functionality. The in-line video quality monitoring of the Cisco 7609-S router successfully passed our test, showing very interesting functionality that could help service providers reduce the amount of equipment required to monitor video-related network quality at the network edge. General availability of the software (“SRE track”) is planned for the last quarter of this year. It seems Cisco also needs to work on the integration of the router-based software and the Video Assurance Management System (VAMS); in our tests, the Cisco engineers used a command-line interface for manual inspection of the quality at each router, which is not feasible for monitoring large-scale production networks.
Cisco’s VidMon is an interesting network-layer video stream monitoring tool. IP video users are generally most pleased with their service when they see no problems on their TVs. In addition to reactive tools like VidMon, we tested a proactive Cisco solution, called "Live-Live," to heal any possible loss of multicast traffic in the network. Two redundant identical broadcast video data streams are sent through the network; the Cisco Digital Content Management (DCM) system selects the better of the two at the egress edge before delivering a healthy video to the user.
This group of independent IP video infrastructure tests was, to the best of our knowledge, the most comprehensive set ever to be released to the public. Using all of EANTC’s German skepticism and years of experience in triple-play proof-of-concept testing for vendors and service providers, we made sure that the tests were performed correctly and that no tricks were being played. Indeed, the results were impressive and must be attributed to the dedicated team of Cisco engineers that prepared and pre-staged the tests. The amount of effort that went into the preparation of the tests is also, nonetheless, in line with similar exercises happening within service providers’ labs. No service provider will deploy such advanced services – or plan to support this number of customers – without putting the planned deployment into a rigorous set of tests.
We acknowledge that some of the tests performed here were a product of Cisco’s great enthusiasm to show off the latest and greatest in technology. We clearly got a first peek of Cisco’s latest operating system code with VidMon and point-to-multipoint RSVP-TE, which is not shipping yet. Nonetheless, these two aspects are contributing factors to Cisco raising the bar and signaling to service providers that it's on track with its IP video road map.
In the next report in this series, we will turn our attention to a very different, but nonetheless imperative, aspect of the network: the end-user applications. We will present the array of user-focused applications that Cisco is bringing to the table – a video network needs applications to be profitable and competitive for the service provider and to make the consumer happy.
— Carsten Rossenhövel is Managing Director of the European Advanced Networking Test Center AG (EANTC) , an independent test lab in Berlin. EANTC offers vendor-neutral network test facilities for manufacturers, service providers, and enterprises. He heads EANTC's manufacturer testing, certification group, and interoperability test events. Carsten has over 15 years of experience in data networks and testing. His areas of expertise include Multiprotocol Label Switching (MPLS), Carrier Ethernet, Triple Play, and Mobile Backhaul.
— Jambi Ganbar is a Project Manager at EANTC. He is responsible for the execution of projects in the areas of Triple Play, Carrier Ethernet, Mobile Backhaul, and EANTC's interoperability events.Prior to EANTC, Jambi worked as a network engineer for MCI's vBNS and on the research staff of caida.org.
— Jonathan Morin is a Senior Test Engineer at EANTC, focusing both on proof-of-concept and interop test scenarios involving core and aggregation technologies. Jonathan previously worked for the UNH-IOL.
Back to Page 1: Introduction
You May Also Like
