In the first head-to-head comparison of 10-Gbit/s routers:* Juniper's M160 outpaced Cisco's 12416 in seven out of the 16 tests* They tied in five, and Cisco won in four* Charlotte's Networks and Foundry Networks failed to place
March 6, 2001

Juniper Wins!
It’s worth repeating: Juniper wins.
But it’s also worth noting: its archrival, Cisco Systems, ran a close second.
Here's the sound bite: After 10 years at the top, Cisco Systems no longerhas to worry about the competition catching up. Now it has a new challenge:Playing catch-up to the performance of routers from rival Juniper Networks.
That’s the simple conclusion to be drawn from six months of arduous testing that pitted Juniper’s flagship M160 against Cisco’s brand-new 12416 in the first head-to-head comparison of 10-Gbit/s routers. It’s also the first time Cisco has agreed to let any of its gear be evaluated in an independent public test.
Actually, “test” is a pretty bland word for what would be considered cruel and unusual punishment in most states. Basically, we threw all the traffic on the Internet — and then some — at these bit-blasters in hopes of cutting through the white noise of vendor white papers. At every step of the way we were ably aided and abetted by our partners in crime: Network Test Inc. of Hoboken, N.J., a benchmarking and network design consultancy; and Spirent Communications of Calabasas, Calif., a test equipment supplier.
Here’s what we found:
Juniper’s M160 is the best of breed. It beat out Cisco’s product in three out of four overall areas: IP, MPLS, and OC192 (10 Gbit/s). Cisco and Juniper shared the honors in the fourth category: OC48 (2.5 Gbit/s) performance.
In some areas, the M160 is in a class by itself: It holds more BGP routes and more MPLS label-switched paths than any other box. It deals with network instability far better. And it exhibits much lower average latency and latency variation.
Specifically, the M160 outpaced the Cisco 12416 in seven out of the 16 individual tests offered, and tied for first with Cisco in five events (see Table 1). Where does that leave Cisco? With an impressive product that pulled ahead of Juniper in the four remaining tests.
Table 1: Results Summary
Charlotte's Networks | Cisco Systems | Foundry Networks | Juniper Networks | Winner | |
IP baseline tests: OC48 | 3* | 1 | 4 | 2 | Cisco |
MPLS baseline tests: OC48 | N/A | 1 | N/A | 1 | Cisco, Juniper |
IP baseline tests: OC192 | N/A | 1 | N/A | 1 | Cisco, Juniper |
MPLS baseline tests: OC192 | N/A | 1 | N/A | 1 | Cisco, Juniper |
Longest-match lookup: OC48 | N/A | 1 | 2 | 2 | Cisco |
Longest-match lookup: OC192 | N/A | 1 | N/A | 2 | Cisco |
BGP table capacity | N/A | 2 | 3 | 1 | Juniper |
MPLS LSP capacity | N/A | 2 | N/A | 1 | Juniper |
Route flapping: OC48 | N/A | 1 | 3 | 1 | Cisco, Juniper |
Route flapping: OC192 | N/A | 2 | N/A | 1 | Juniper |
Convergence: OC48 | N/A | 2 | 3 | 1 | Juniper |
Convergence: OC192 | N/A | 2 | 3 | 1 | Juniper |
Filtering: OC48 | N/A | N/A | 2 | 1 | Juniper |
Filtering: OC192 | N/A | N/A | N/A | 1 | Juniper |
Class of service: OC48 | N/A | 1 | N/A | 1 | Cisco, Juniper |
Class of service: OC192 | N/A | 1 | N/A | 2 | Cisco |
* Numbers represent relative ranking |
For a yet more detailed breakdown of the test results, click here.There’s no doubt that the 12416, with its OC192c interfaces and 320-Gbit/s switching fabric, is a vast improvement over its GSR predecessor. Keep in mind that Cisco’s product is new — and thus less seasoned than Juniper’s M160, which has been shipping since spring 2000. In fact, Cisco’s new offering is just a memory upgrade and a couple of features away from being a serious threat to Juniper.
Now things get interesting.
There’s only one way for Cisco Systems Inc. (Nasdaq: CSCO) to take its second-place finish: personally. Over the past few years it’s watched Juniper Networks Inc. (Nasdaq: JNPR) walk away with market share (some would suggest that “run away” is a more apt description). Its stock, which once seemed to deny the laws of gravity, is in freefall. Cisco didn’t just want a win; it needed one. But the test results prove it’s not about to walk away from the core market.
So if Cisco and Juniper have at each other, does that mean other core router vendors stand to benefit from the bloodshed? Not in this market. True, there are a bunch of startups out there that claim they can deliver something the market leaders can’t. Unfortunately, what most can’t deliver is a core router. We issued our call for products to 11 vendors. There were only two other takers besides Cisco and Juniper: Charlotte’s Networks Ltd. and Foundry Networks Inc. (Nasdaq: FDRY).
How did they do? Let’s just say we were underwhelmed by the test results. Maybe Foundry got the message. After we’d finished testing its product, it announced that it was bailing out of the core router business. Smart move (see Foundry Retreats from the Core). This market belongs to our two top finishers for the foreseeable future.
Then again, both Foundry and Charlotte’s Networks deserve credit for having the guts to show up. Avici Systems Inc. (Nasdaq: AVCI; Frankfurt: BVC7), which is the number three core router player in terms of market share, had agreed to take part but, in the end, thought better of it — they didn't show.
Links to the individual sections:
The Core of the Problem
Building a Better Testbed
OC48 Throughput and Forwarding
OC192 Throughput
MPLS Throughput
Looking at Latency
Packet Ordering
Longest-Match Lookups
BGP Table Capacity
MPLS Tunnel Capacity
Route Flapping
Convergence Testing
Focus on Filtering
Quality of Service
Test Methodology Core router vendors claim their boxes are the building blocks of the next-generation Net. That made our task easy: All we had to do was build a testbed that simulated the conditions likely to be found out there in Tomorrowland. Any box that didn’t melt down or spontaneously combust was probably up to the challenge.
So with fire extinguishers at the ready, we sketched out a few guiding principles:
Everyone knows the Internet, which now comprises some 96,000 networks, is only going to get bigger. So we decided to test with routing tables that represent more than 200,000 nets. Then we did a few back-of-the-envelope calculations and realized that at its current growth rate, the Net could readily double in size in 18 to 24 months. So we ripped up the envelope and extended the routing tables used in some tests beyond 2 million networks — more than 25 times the number core routers currently contend with.
Size isn’t everything, of course. To make sure we didn’t slight the speed freaks out there, we blasted those new OC192 (10-Gbit/s) interfaces from Cisco and Juniper with more than 270 million packets per second (pps).
Performance problems? MPLS (multiprotocol label switching) is supposed to make them a thing of the past by letting service providers set up “tunnels” across their networks. When we weren’t ramping up router tables or pumping packets, we’d have to dig into the behavior of this Layer 2 technology.
At this point, any sane test team would have started looking for work in the service industry. Instead, we cranked up the espresso maker and got ready to build a testbed — or, as it turned out, to build two.
Our original call for products requested four boxes from each participating vendor (see Table 3).
Dynamic Table: Selected Vendors of Internet Core Routers
Select fields:
Show All Fields
VendorProduct/software version testedPOS interfaces (maximum per chassis)Other interfaces supportedMaximum routing table memoryRedundant componentsTraffic control mechanismsMPLS supportPrice with OC48 core(1)Price with OC192 core(2)
Our plan was to set them up in a fully meshed configuration, with each box connected to all the others via 12 “core interfaces.”
We also required additional “edge interfaces” to offer test traffic from Spirent’s Smartbits 6000 analyzers equipped with the vendor’s new 3505 Terametrics cards (see Detailed Methodology). These would deliver enough aggregate traffic to saturate the core links.
But what speed interfaces should we specify?
We knew that OC48c (2.5 Gbit/s) packet-over-Sonet (POS) interfaces represent a sweet spot among vendors in this market, so we assumed they would be a safe bet. One or two vendors were shipping or getting ready to ship OC192c POS, but we didn’t want to knock anyone out of contention by demanding the higher-speed ports or penalize vendors who had so few OC192 modules that they would wind up being evaluated at OC48.
Wrong.
Some vendors initially declined to participate because our test plan lacked OC192. So we did the only logical thing. We built two testbeds.
On the OC48 testbed, each router had three core and three edge interfaces, for a total of 24 OC48c interfaces.The OC192 testbed was four times bigger. Each router packed three OC192c core interfaces and 12 OC48c edges. In total, there were 48 OC48c and 12 OC192c interfaces. Do the math and you’ll see that the edge interfaces on both testbeds offered just enough capacity to fully subscribe the core interfaces (but not congest them).
Charlotte’s Networks and Foundry opted to be tested only with an OC48 core. Cisco and Juniper were evaluated with both cores. (To allow us to compare results meaningfully, we required any vendor that showed up with OC192 to be tested on the OC48 testbed as well.)
Since we wanted to know how these core routers would stand up under conditions that might be found on the Internet as early as next year, we modeled our traffic on live Internet core links. Our sources included the MAE-East and MAE-West traffic exchanges; a collection of 35 major ISPs; and Merit Network, the Michigan-based ISP consortium.
We also used live Internet samples from Merit to develop a traffic pattern we called Internet mix (Imix). This was based on the IP (Internet Protocol) packet size and percentages sampled over a two-week period: 40 bytes (56 percent of all traffic); 1,500 bytes (23 percent); 576 bytes (17 percent); and 52 bytes (5 percent — with totals adding to more than 100 because of rounding).
To get a complete performance picture, we also offered traffic consisting entirely of 40-byte IP packets. Yes, we’ve heard all the (endless) complaints that testing with short packets is unrealistic. If you’re interested in hashing this out again, read the Test Methodology. Carefully. If you’re interested in stressing core routers, test with short packets.
We conducted up to nine separate tests on each device: baseline IP forwarding and latency; baseline MPLS forwarding and latency; maximum BGP (border gateway protocol) table capacity; maximum MPLS label-switched path (LSP) capacity; longest-match lookup times; route flapping; convergence; IP class-of-service handling; and packet filtering.
We ran two tests — BGP and LSP table capacity — on just one of the testbeds; both routines measure device memory rather than interface speed. Speed is key to the other tests, so we repeated them on both testbeds.
Our first test blasted packets to each interface on the testbed. Destination addresses covered nearly all 200,000+ routes in our tables. We offered traffic at up to and including wire speed and measured throughput, forwarding rate, latency, and packets in sequence on all interfaces.
Cisco and Juniper came through with flying colors on the OC48 testbed (see Figure 1). Cisco’s 12416 hit 100 percent with both 40-byte and Imix loads. Juniper was close behind, forwarding 99.8 percent of 40-byte packets and 99.9 percent with Imix. Actually, in a one-off test run, Juniper did achieve line-rate throughput with both loads, but only by bumping up its buffers and thus increasing latency. Faced with the tradeoff, the vendor opted to restore its default settings and take a minor hit on throughput.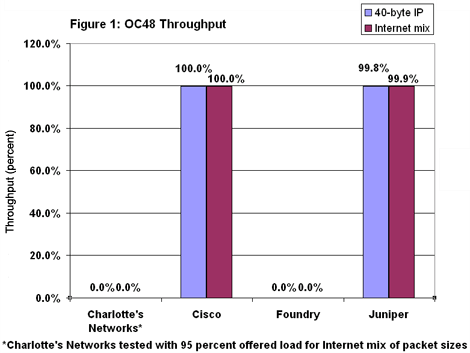 Charlotte’s Networks and Foundry choked. No matter how low we dropped the offered load, neither vendor could deal with the 40-byte stream or Imix without junking packets. Even with an offered load of just 1 percent of line rate, both routers dumped some packets. That puts throughput right at zero.
Throughput tends to be a slippery word in this business — despite the fact that RFC 1242, the router testing terminology document, unambiguously defines it as the highest offered load a device can forward with zero packet loss. Marketeers often try to fudge the issue with claims of “throughput with minimal packet loss.” Like the fabled unicorn, there ain’t no such animal.
Another popular misconception is that throughput means offering traffic at line rate and then counting the packets a box does deliver, ignoring any loss. Throughput means zero loss, period. Why all the fuss about a few percentage points? Packet loss has very real consequences for application delays and timeouts.
Throughput is critical, but to get a fuller picture of router performance, we also evaluated forwarding rate at maximum offered load. In this test, we offer packets at line rate (or the highest rate we ran against a given router) and count packets received, loss or no loss.
The results are far more even than for throughput (see Figure 2). Cisco again tops the field, with Juniper close behind.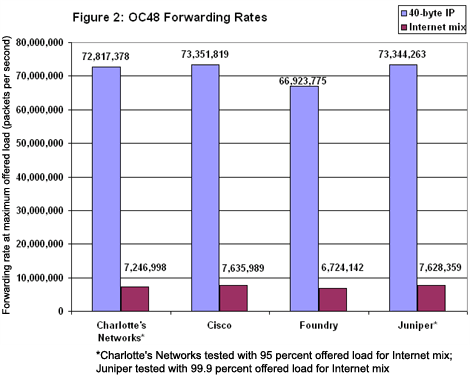 Charlotte’s router appears to have earned a respectable third-place showing. What the numbers don’t show is that some of the Aranea-1’s routing table entries disappeared during our tests (poof!). Before testing, we verified that the vendor’s routing tables contained all entries. But under heavy loads, the routers simply deleted entries — something we were able to prove by capturing and decoding line-rate traffic with Spirent’s Adtech AX4000 analyzer. Charlotte’s Networks says it supplied us with prerelease software and has since developed more robust code. That may be, but the vendor was not able to come in for retesting — even though we offered several time slots.
Foundry’s routers also dropped packets during the forwarding rate tests. On the bright side, its routers began and completed the tests with the same number of entries in their routing tables.
The OC192 throughput tests offered four times as much traffic — more than 8 billion packets with the 40-byte load, at aggregate rates of 115.2 Gbit/s — over four times as many edge interfaces. Would throughput scale linearly on the new OC192c interfaces from Cisco and Juniper?
Not necessarily.
Cisco’s 12416 again achieved line-rate throughput when handling Imix (see Figure 3). But throughput fell to just 52 percent with 40-byte IP packets. This means the 12416 will forward traffic at up to 52 percent of line rate without loss. It does not mean the device will drop 48 percent of a load offered at wire speed. (If you want the explanation again, scroll up a few screens and start reading). In fact, both Cisco and Juniper can forward 40-byte packets at rates well above 99 percent, albeit with some packet loss.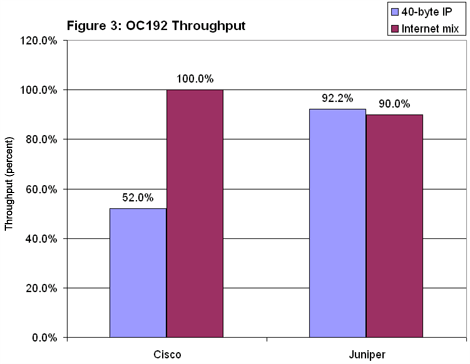 Juniper’s OC192 IP baselines showed less of a split, although throughput with 40-byte and Imix loads was lower than in the OC48 tests. Curiously, the M160 did slightly better with short packets than with Imix — 92.2 percent vs. 90.0 percent. This is counterintuitive, since short packets should place a far heavier burden on the router. Equally curious were the somewhat inconsistent results seen with Imix. In some runs the M160 achieved 90 percent; in others, the drop threshold was 89 percent. (We report the better of the two results here.)
We aren’t able to fully explain this phenomenon. Neither can Juniper. The vendor’s engineering staff initially charged that our Imix load somehow oversubscribed the M160. One engineer set up a test that “proved” Juniper’s case (at least until we pointed out numerous discrepancies). The company’s co-founder and CTO, Pradeep Sindhu, even got involved. We hauled out the Spirent Adtech analyzer again and demonstrated that the Imix and the 40-byte loads were always completely symmetrical across all interfaces.
Juniper ultimately backed away from its charge of oversubscription and accepted that Imix throughput is 90 percent. About the only thing we can say with certainty is that we hit a threshold somewhere between 89 percent and 90 percent. In such “corner cases” it’s not uncommon for results to vary across multiple iterations.
In addition to the IP baselines, we ran the same tests over MPLS to get a sense for how this relatively new Layer 2 technology compares with straight IP routing.
MPLS is a connection-oriented scheme that maps a large number of Layer 3 routes onto a single path, or tunnel, across a network. Once a tunnel is established, all packets with destinations at the other end get switched at very high speeds, with no routing lookups required. MPLS labels also allow for fine-grained traffic classification, which providers find useful for quality-of-service and security.
Foundry is the only participating vendor that doesn’t support MPLS. It claims it has MPLS code in development, as does every other router vendor that doesn’t already support label switching.
In the baseline tests, we offered the same traffic loads, with one exception: MPLS adds a 4-byte label to every packet transmitted. In theory, that 4-byte overhead should mean that MPLS throughput is slightly lower than IP’s.
On the OC48 testbed, though, both Cisco and Juniper delivered the same throughput as they did with IP routing (see Figure 4). Things got more interesting on the OC192 testbed: Cisco’s throughput for 40-byte IP packets leapt from 52 percent to 100 percent. In fact, it was in this test that Cisco’s 12416 produced the highest data rate we saw during the entire project: 271.3 million pps.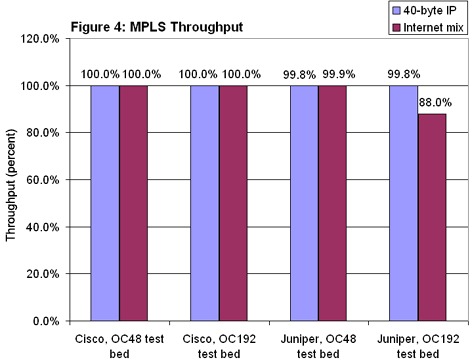 Juniper’s M160 also forwarded 40-byte IP packets over MPLS faster than it did over IP — hitting 99.8 percent compared with 92.2 percent in the IP baselines. That’s nearly as fast as Cisco, representing a forwarding rate of about 270.7 million pps. When it came to the Imix load, however, the M160’s throughput slid from 90 percent over IP to 88 percent over MPLS.
These are encouraging results for MPLS advocates. In comparison with IP routing, throughput decreases in only one out of eight points of comparison in the baselines (and then only slightly), rises in two places (in one test by quite a lot), and remains unchanged in the rest.
Note that time constraints prevented us from completing MPLS tests, or any tests other than the IP baselines, on the Aranea-1 from Charlotte’s Networks. Despite repeated attempts we were unable to arrange a return visit to the lab.
Latency — the amount of delay a router introduces — is at least as important as throughput for some users. It’s actually more important when routers handle delay-sensitive apps like voice and video.
Ideally, latency should be both low and constant. A router that exhibits high delay variation (jitter) will degrade delay-sensitive apps as much as, or more than, one with high latency alone.
In the course of the throughput tests, the Spirent Smartbits generator/analyzers timestamped every packet generated; then on the receiving end they calculated how long the journey took. Since the Smartbits are accurate to 100 nanoseconds (ns), this gave us a very detailed, precise snapshot of latency over time.
The OC48 latency measurements for 40-byte packets show significant variations among vendors (see Figure 5). Juniper had the best numbers by far, registering an average of 15 microseconds with variations between a minimum and maximum of less than 8 microseconds.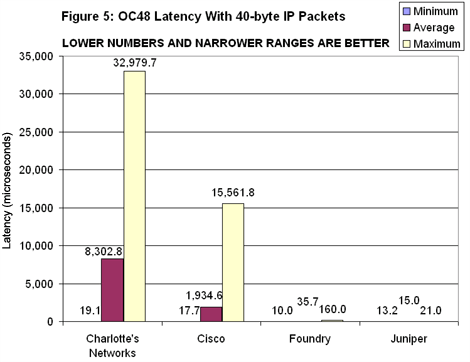 Charlotte’s Networks had highest average latency and the widest variation between minimum and maximum. There may be at least a partial explanation for those results. Latency should be measured only at the throughput level; working with higher offered loads actually gauges buffer depth rather than the time a device needs to forward a packet.
Since we were unable to obtain any throughput measurement for Charlotte’s Aranea-1, we looked instead at traffic offered at line rate. We know this load overflowed the Aranea-1’s buffers because of the packet loss we recorded in the forwarding rate tests. It’s possible, then, that the high latency numbers we recorded were partly a function of forwarding delay (the thing we were really trying to measure) but mostly a function of buffer depth.
The only problem with this explanation is that it doesn’t hold up for the results recorded for Foundry’s Netiron, which also failed the throughput tests. But in this case, when we offered it traffic at line rate, it exhibited relatively low latency — lower even than Cisco’s 12416, which didn’t drop packets.
It may be that the Netiron simply has small buffers. But given the relatively small gap between minimum and maximum latency a more likely explanation is that Foundry does a much better job than Charlotte of keeping delay low and constant.
We expected Imix to produce higher latency readings, since it takes more time to forward a long packet than a short one. That’s not what we saw (see Figure 6). This time, Charlotte’s Networks posted the lowest variation between maximum and minimum. It may have posted the best average latency as well. Unfortunately, a script configuration error on our part kept us from recording average latency for this test. If we use a different accounting method, we can derive latency of 64.9 microseconds, exactly the same as Juniper’s M160. But remember: We tested the Aranea-1 at 95 percent load and the M160 at 99.9 percent load. Under the heavier load, the Aranea-1 may have exhibited greater delay.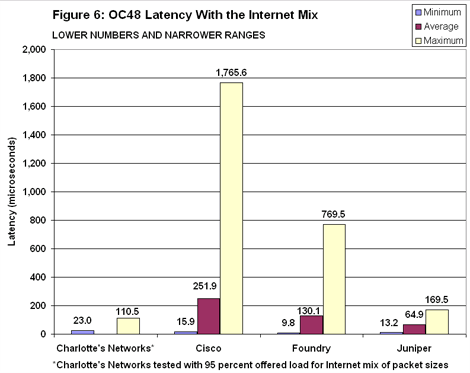 Juniper’s numbers with Imix are again reassuringly constant, with maximum latency registering less than 170 microseconds. Cisco’s maximum latency is 10 times greater, and average latency roughly four times higher. As noted, both Cisco and Juniper made judgment calls during the throughput tests: Cisco opted for higher throughput; Juniper went for much lower latency.
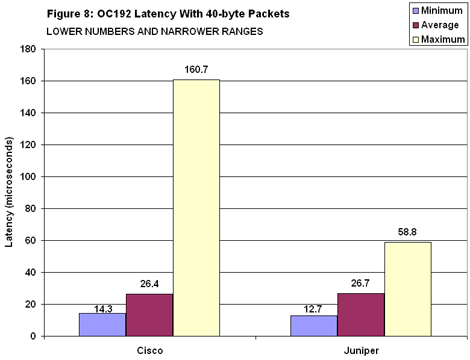
When it came to measuring MPLS latency, Juniper’s delay was low and constant and about the same as it was with IP routing (see Figure 7). But Cisco’s latency jumped from 2 milliseconds to 16 ms when moving 40-byte IP packets over MPLS. Latency for Imix over MPLS wasn’t as high as with short packets, but it did rise from 250 to 650 microseconds.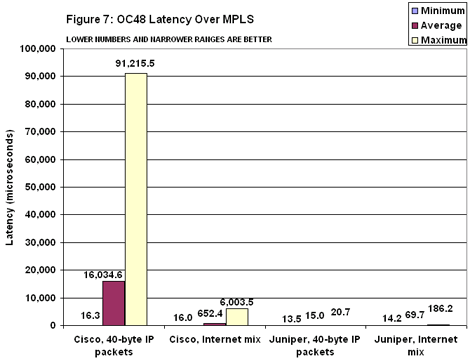 On the OC192 testbed, both Cisco and Juniper posted substantially lower latency numbers for 40-byte packets over IP than they did on the OC48 testbed (see Figure 8). Both also sharply reduced the spread between minimum and maximum, though Juniper’s M160 once again showed much less variation between top and bottom.
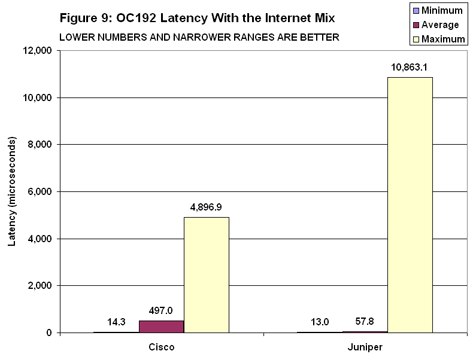
 Juniper also fared better than Cisco when handling Imix (see Figure 9). To be fair, Juniper’s maximum latency of nearly 11 milliseconds was more than double Cisco’s. But Juniper’s average latency was nearly 10 times lower than Cisco’s. Indeed, Cisco’s 500-microsecond average is roughly twice that recorded on the OC48 testbed. Again, it may be possible to achieve lower latencies with the 12416 by configuring smaller buffers, but this may risk packet loss.
 The latency gulf between Cisco and Juniper widened further in the OC192 MPLS baselines (see Figure 10).
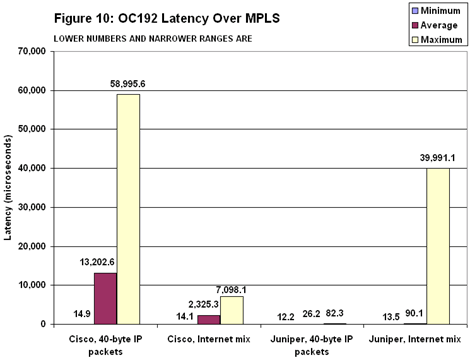 Juniper’s M160 posted about the same average latency as with IP routing. But moving to MPLS meant a dramatic increase in delay for Cisco. With 40-byte packets, average latency shot up from 26.4 microseconds with IP to 13 milliseconds with MPLS — a 500-fold increase.
Average latency also rose with Imix, rising from just under 500 microseconds with IP to more than 2.5 milliseconds with MPLS.
Again, as Agatha Christie might say, the buffer did it. (At least that’s the most likely explanation.) These tests clearly show the penalty of tuning buffers to achieve line-rate throughput.
Ever since Juniper introduced its OC192 interface in early 2000, Cisco’s sales force has jumped on a supposed problem with packet reordering. This reordering occurs because there are actually four paths through Juniper’s OC192 card, which means that packets taking different paths can arrive out of sequence.
This subject has become something of a point of honor in the marketing war between the two vendors, with resident experts on both sides explaining why packet reordering is, or is not, an issue.
Since the Smartbits records whether packets arrive in sequence, we were able to determine exactly how much reordering actually does occur and also analyze what impact it may have. (For the record, we should note that packet sequencing was not one of the metrics stated in the original test methodology. But in pursuit of Peace in Our Time, we thought it best to tackle this touchy subject.)
Let’s start by saying that Cisco is right — at least on one count. Juniper’s OC192 interfaces do reorder some packets, both for IP and MPLS traffic (see Figure 11).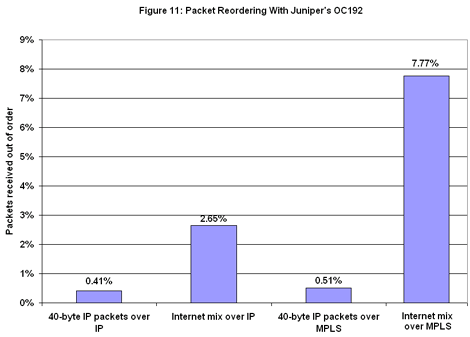 When forwarding 40-byte IP packets, Juniper’s OC192 cards reordered at most 0.51 percent of traffic for IP or MPLS. With Imix, packet reordering increased to 2.65 percent over IP and 7.77 percent over MPLS.
We also noticed that reordering occurs on the OC192 cards whenever traffic rates exceed 73 percent of line speed with Imix or 56 percent with IP. There was no reordering whatsoever in the OC48 testbed.
In the world according to Cisco, reordering is a Very Bad Thing for TCP (Transmission Control Protocol) connections, which carry 90 percent or more of all Internet traffic. Cisco notes that TCP expects packets to be received in order. If they’re not, retransmissions can occur, leading to higher latency. If the delays are long enough, connections can time out.
To prove its point, Cisco cites a paper issued by The Institute of Electrical and Electronics Engineers Inc. (IEEE) and the Association for Computing Machinery (ACM). Written by two eminent computer scientists, Jon C.R. Bennett and Craig Partridge, it posits that the probability of a TCP connection on the Internet experiencing packet reordering is greater than 90 percent. The paper goes on to attribute much of this reordering to Digital Equipment Corp. switches in network exchange points. (You can check out the evidence yourself at http://puck.nether.net/cisco-nsp/packet_reordering1.pdf.)
Curiously, Juniper gives customers the same paper to explain away reordering; and it offers four arguments as to why the whole thing is a nonissue.
First, it notes that the reordering we saw was nowhere near the 90 percent-plus reported by Bennett and Partridge.
Second, it says reordering is significant only on a per-connection basis; Internet core circuits carry thousands of concurrent connections. Even if two packets do arrive out of order, Juniper says there’s a very low probability of any two packets belonging to any one connection. The vendor also says that it consciously and very willingly decided to trade off some reordering to gain higher throughput and lower latency for all the connections in the pipe.
Third, Juniper notes that TCP and Spirent Smartbits use different methods to account for packet reordering. It also says Smartbits reports more reordering than any TCP implementation would experience.
Finally, Juniper says the impact of reordering by its OC192 interfaces is not cumulative. In other words, if one OC192 interface puts packets out of order, another one down the line is just as likely to put the packets back in place.
So the war of words continues. Fortunately, Light Reading is prepared to illuminate this controversy:Reordering can have a very negative impact on TCP connections, dramatically increasing delay.
True.
Reordering can lead to retransmissions, delays, and even connection timeouts. But this begs the question of how much delay is acceptable.
Delay is a function of TCP implementation, link speed, link congestion, device reordering, and many other considerations. The maximum latency numbers presented here can serve as a guideline for how much delay each vendor’s routers will introduce because of reordering and other factors.
Reordering is significant only on a per-connection basis.
True and false.
It’s true that two reordered packets may have an impact on any one connection only if both packets belong to that connection. But it’s equally possible that reordered packets belonging to two different connections may have an impact on both.
Internet core circuits may carry thousands to hundreds of thousands of concurrent TCP connections.
True, as far as it goes.
Juniper’s argument suggests that a pipe handling many TCP connections will interleave packets from each connection (for example, each of 50 connections might be represented by one packet, followed by 49 packets belonging to other connections). In essence, the argument assumes that any risk of reordering will be shared equally by all connections in the pipe.
The trouble is, TCP traffic is inherently bursty, with multiple packets from a given connection typically clumped together. There is no general answer as to how much interleaving will occur on a given TCP link. The key issues here are how much interleaving occurs, and how much distance exists between reordered packets. The answers to those questions will differ on any given network.
TCP connections may experience a lower percentage of reordered packets than we saw in our tests.
True.
If a Smartbits interface receives five packets ordered 1, 2, 4, 3, 5, it records only two packets as being in sequence — packets 1 and 2. In contrast, a TCP receiver would experience only one disruption — packet 3.
This difference in accounting methods does not mean the actual impact on TCP will be three times lower than the Smartbits numbers. Even one disruptive packet can take a long time in arriving, resulting in high latency or, eventually, a connection timeout.
Multiple interfaces will not have a cumulative effective on packet reordering.
False.
If one Juniper OC192 card scrambles some packets, a second OC192 interface has an equal likelihood of correcting the reordering; scrambling the packets further; or making no change. Thus, the impact of multiple OC192s is neither additive nor subtractive.
Perhaps the best way to characterize the reordering issue is to say that its probability is fractal. If one OC192 interface reorders 2 percent of packets, then 100 or 100,000 interfaces have the same probability of reordering 2 percent.
It would be nice to offer a definitive yes or no answer to the whole reordering debate. Nice, but not accurate.
Our test results suggest that Juniper’s OC192 reordering is nowhere near as big a problem as Cisco claims. Nor is it a complete nonissue, as Juniper contends. Since different networks handle different numbers of TCP connections, and since TCP implementations vary widely, we may never be able to completely resolve the question completely.
But there are two statements we can make with certainty (pay attention, they will be on the final):
First, users of Juniper’s OC192 cards won’t experience packet reordering until interface utilization exceeds 73 percent (or 56 percent for those strange few whose traffic consists entirely of 40-byte IP packets).
Second, given the information at hand we can’t definitely prove that reordering will never pose a problem under any circumstance. There’s only one surefire means of eliminating reordering as an issue: Don’t do it in the first place.
We moved beyond the baseline tests to our longest-match routine, which examines whether a router’s throughput suffers when we increase the number of route lookups it performs.
We offered exactly the same traffic as in the baseline tests. But this time, we added about 50,000 more entries to each device’s routing table. These were very close to the existing listings but used shorter subnet masks, forcing the router to arbitrate between similar entries.
For example, if the basic routing table contained an entry for network 1.2.3.0/24, which has a 24-bit subnet mask, we might add 1.2.0.0/16, a similar address with a 16-bit mask. The router should choose the prefix with the 24-bit mask, because it's the most specific match available — in other words, it's the longest match.
Ideally, the results of the baseline and longest-match tests should be identical. Cisco and Juniper confirmed that. Foundry’s forwarding rate actually improved by a small margin, rising 0.37 percent when handling 40-byte IP. But its forwarding dropped 5.71 percent with Imix.
Longest-match latency measurements also were fairly close to the baselines. On the OC48 testbed, average delay for Cisco’s 12416 fell for both traffic loads — by 2 percent for 40-byte IP and by 22 percent for Imix.
Foundry’s longest-match latency reduction was even steeper: Average latency with Imix dropped by 27 percent. Juniper’s measurements were nearly identical to the baselines, with one exception: On the OC192 testbed, latency rose by 11 percent with Imix.
We also conducted two capacity tests to determine how many different networks a router can address — one focusing on BGP table size, the other on the number of MPLS label-switched paths a router can establish.
Why the worry about BGP capacity?
Through most of the 1990s, the number of BGP networks grew at a fairly linear rate. In the past 18 months or so, however, that number has started to grow at a near exponential rate. It’s not out of the question to expect tables to at least double or triple in size over the next few years.
We devised a simple two-interface test to determine how future-proof these core routers are. Attaching a Smartbits Terametrics analyzer to one router interface, we brought up a BGP session and began advertising networks in blocks of 40,000. We also brought up a second BGP “peer” on another interface using another Smartbits Terametrics card.
Barring any special circumstances (and there were none in this test), BGP requires the router to re-advertise to peer 2 any routes learned from peer 1. If the second Smartbits verified that the router successfully learned all the offered routes, we added another 40,000 more routes. We kept repeating this procedure until the router failed to propagate all offered routes.
Juniper’s M160 was the easy winner, learning 2.4 million routes (see Figure 12). Cisco mastered nearly 400,000; Foundry, just under 256,000.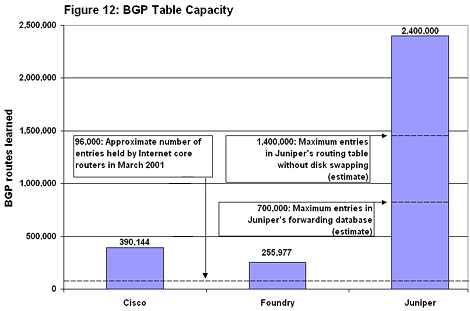 Interested in putting that 2.4 million in perspective? It represents 25 times the number of networks in the core of today’s Internet.
Raw numbers aside, there are several factors to consider when trying to gauge how well any router will scale in a production setting.
First, BGP table capacity is largely a function of device memory. Juniper’s M160 accommodate up to 768 Mbytes of RAM, and the vendor supplied its boxes fully loaded.
In contrast, Cisco’s 12416 tops out at 256 Mbytes. The vendor says it will soon release a new version of the 12416 that accommodate “gigabytes” of memory. Although Cisco didn’t quote an exact spec, it’s a safe bet that a 12416 with 1 Gbyte or more of RAM will learn vastly more than 400,000 routes.
Second, Foundry’s top end of 256,000 entries is self-imposed, thanks to a hard-coded upper limit in its current software release. A limit like this can be a very good thing, since it ensures memory will always be available for other tasks.
That brings us to the third issue, Juniper’s memory use. The M160’s control plane — the part that handles IP routing functions, as distinct from forwarding functions — is essentially a high-end PC with its own CPU and hard drive. Even with 768 Mbytes of RAM, the control plane’s physical memory is full at around 1.4 million routes. After that, the M160 begins “swapping,” or writing memory contents to hard disk. The M160 stopped learning routes above 2.4 million because it was out of swap space. Even if more room were available, the router would not have been able to do much constructive work, since all its RAM and a good part of its disk were fully consumed with BGP learning. The lesson: a large number of entries, by itself, does not mean a router can actually exchange data with each and every one.
Finally, the M160 — like all routers — maintains a Layer 2 forwarding table that’s distinct from its Layer 3 BGP table. Juniper estimates the capacity of its Layer 2 table (called a “forwarding information base” in Juniper-speak) to be somewhere between 600,000 and 800,000 entries. So while it’s possible for the M160 to store 2.4 million routes, in practice it will only be able to address around 700,000 of them at any given instant.
We performed a similar test comparing MPLS tunnel capacity. Cisco and Juniper were the only participants; Foundry says support is under development.
Because MPLS is connection-oriented, routers must first set up a tunnel, called a label switched path (LSP), before they can exchange data. MPLS is in its early stages, but service providers already are looking to build networks comprising thousands or millions of tunnels.
Those expectations may be a bit premature, if our test results are any indicator (see Figure 13). Juniper built 10,000 LSPs; Cisco topped out at 5,000.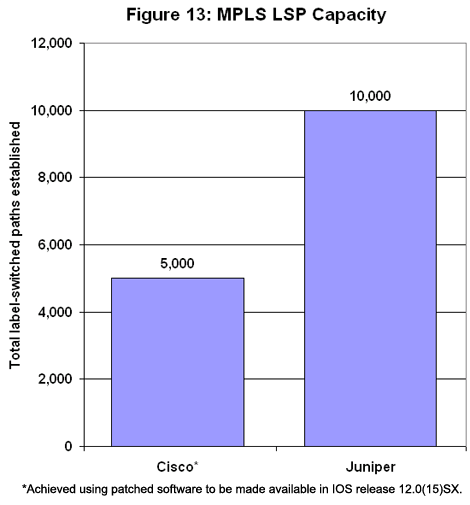 As in the BGP capacity tests, there are a couple mitigating factors. But this time they could result in substantially higher counts in production environments.
First, we used standard RSVP signaling to set up tunnels between Smartbits cards. RSVP sends keep-alive messages every 30 seconds or so, which adds up to a lot of management overhead for 10,000 tunnels.
Both Cisco and Juniper support a proposed extension to RSVP called “refresh overhead reduction” that promises to considerably lighten that load. Both vendors claim their LSP counts would be much higher with refresh reduction enabled.
Second, Cisco’s 12416 is brand new. On our first run, the 12416 set up fewer than 3,000 tunnels, but the vendor quickly supplied a software patch that boosted tunnel count. Cisco says the patch will be available to customers as part of IOS release 12.0(15) SX, by the time this test is posted to the Light Reading Website. In all the configurations we’ve examined so far, the routing tables have never changed during the course of a test. Core routers on live networks will never have it so easy. Tens of thousands of routes may disappear within the course of a single second, taking huge chunks of the Internet with them. Or thousands of new routes may materialize all at once.
How well do core routers deal with this kind of instability?
To find out, we conducted two routines in which we radically altered the state of the BGP tables during the test run. The first test examined route flapping, the condition in which numerous routes are withdrawn and re-advertised in rapid succession. The second test, of router convergence, was even more stressful: We advertised a routing table more than twice the size of today’s Internet while hammering devices with high-speed traffic.
In the flapping test, we began by bringing up BGP sessions on all interfaces and loading the routers with the same 200,000+ entries used in the baseline tests. We also loaded up 200,000 secondary and 200,000 tertiary routes, to be used if the primary routes went down. (What Black Arts allowed us to squeeze 600,000 entries into boxes with less BGP capacity than that? We didn’t. BGP tables, at least the ones we tested, count only the number of active entries.)
Then we offered traffic, lots of it — 40-byte IP packets at line rate — to all interfaces. Thirty seconds into the test, the BGP sessions running on the Smartbits withdrew 50,000 routes. All of the withdrawn routes had secondary entries, so there was always some route available for every packet transmitted.
Thirty seconds later, we readvertised the 50,000 primary routes we’d withdrawn. Since flapping often occurs in waves on production networks, we repeated the withdraw/readvertise cycle three times, with events spaced 30 seconds apart.
A perfect router would survive this test with little or no performance degradation. The forwarding rate on the 150,000 or so stable paths, where we didn’t change routing information, should be flat. Ditto for the flapped paths, since packets should be switched over to secondary paths almost instantaneously.
Better yet, a perfect device should show almost no difference in forwarding rates between stable and flapped paths. (We should note that a small amount of packet loss is inevitable, since we offered traffic at line rate at the same time we introduced BGP updates.)
It appears that perfect is a long way off.
On stable paths, Cisco’s 12416 came closest to forwarding packets with almost no change in rate, at least on the OC48 testbed (see Figure 14). But the Cisco routers seriously degraded forwarding rates on the flapped paths.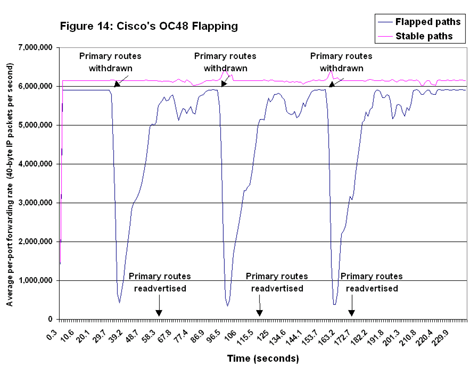 Further, forwarding rates on the flapped paths take a relatively long time to recover. Cisco estimated that its convergence time — the time needed for routing updates from one interface to be propagated across the network — was a bit longer than the 30-second intervals we used in our tests.
Forwarding rates for Juniper’s M160 on stable OC48 paths weren’t as steady as Cisco’s, but they were close (see Figure 15). The M160 also did much better on flapped paths: Forwarding rates didn’t degrade as much as Cisco’s, and convergence occurred relatively quickly after each event. But forwarding rates on both stable and flapped paths began to degrade after the final flap event, evidenced by the wobbly lines toward the end of the test run.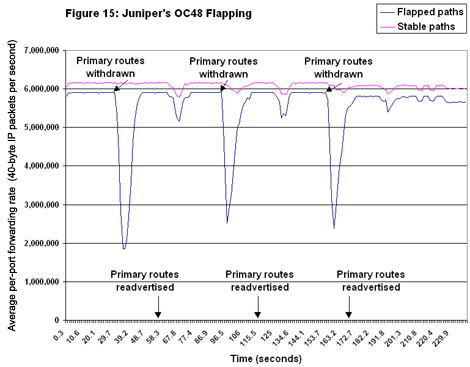 Foundry foundered on the OC48 flap tests (see Figure 16). Essentially, the Netiron went down and stayed down (for the count) after the first route withdrawal. Forwarding rates on both stable and flapped paths plummeted, and although stable-path forwarding rates outpaced those on flapped paths, neither ever recovered from the initial shock of a massive withdrawal. Curiously, there was a small time delay between the point at which we withdrew routes (around 30 seconds into the test) and the point at which things fall apart; a high propagation delay is the most likely explanation.
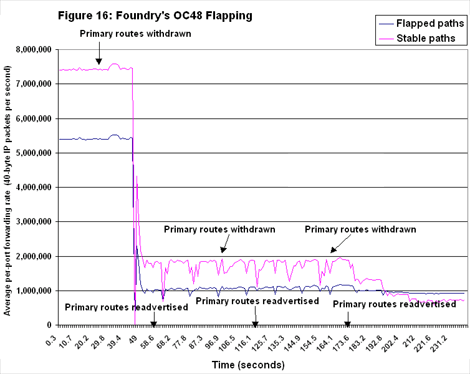 After reviewing the test results, Foundry said it found and fixed a bug inits FPGA (field-programmable gate array) firmware that would explain its flappingfiasco. The vendor conducted some internal retests that produced excellentresults — very close to Juniper's, in fact — but Network Test did not verifythese numbers.
We didn’t see anything approaching a flat line during the flapping tests on the OC192 testbed.
Juniper did exhibit less variation between stable and flapped forwarding rates, compared with Cisco or its own OC48 results (see Figure 17). Further, stable and flapped forwarding rates were virtually identical after three events, as they should be.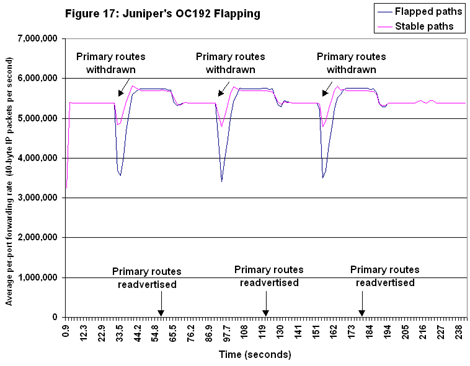 On the downside, the M160’s average per-port forwarding rate of roughly 5.4 million pps is significantly off the 6 million pps pace it achieved in the OC48 tests.
Cisco’s OC192 forwarding rates weren’t as smooth as Juniper’s (see Figure 18). Although the 12416 did a better job of recovering on flapped paths than it did in the OC48 tests, forwarding rates on both flapped and stable paths are characterized by jagged lines. Further, average rates for both traffic types degrade during the test run. The good news? Rates for stable and flapped paths remain closer than they did on the OC48 testbed.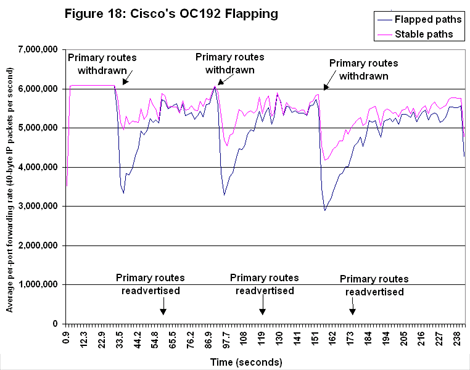 The effects of flapping can be lessened to some extent by route dampening, a feature supported in all the boxes we evaluated. Dampening tells a router to ignore BGP state changes for some period if it receives too many updates within a given interval.
Sounds good, but a router still has to be able to deal with at least one significant change in table state before this feature kicks in.
Our convergence test was designed with one goal: Stress core routers to the max. All the devices under test had to do was accept and propagate an entire routing table, while also forwarding 40-byte packets at near line rate.
We began this event by bringing up BGP sessions using all the Smartbits interfaces, but sending zero entries to the devices’ routing tables. Then we blasted 40-byte IP packets at 90 percent of line rate, even though the devices had no place to send them. Sixty seconds into the test, we instructed the Smartbits to advertise all 200,000+ entries we used in the baseline tests. Sixty seconds later, we told the Smartbits to withdraw the entire routing table. We repeated the cycle three times, all the while offering packets at very high rates.
And you thought torture was outlawed by the Geneva Convention.
A theoretically perfect device would produce a result that looked like part of the New York City skyline. For the first 60 seconds, its forwarding rate would be zero, since the routers have no place to send the traffic we offer. Then it would accept and propagate the full routing table instantaneously, producing a vertical line as the forwarding rate climbs from zero to the theoretical maximum. For the next minute, the device would forward traffic at the theoretical maximum, yielding a perfectly horizontal line. Then there should be another vertical line headed down to zero as all routers instantaneously flush all routes from their tables.
Since we repeated the cycle three times, a perfect device should have produced a result that looked like three buildings in a city skyline — not a pile of rubble.
On the OC48 testbed, Cisco and Juniper built structures that, if not perfect square waves, at least resembled a Bauhaus blueprint (see Figure 19). Juniper’s routers converged much faster than did Cisco’s, giving the former results that are much closer to a perfect rectangle.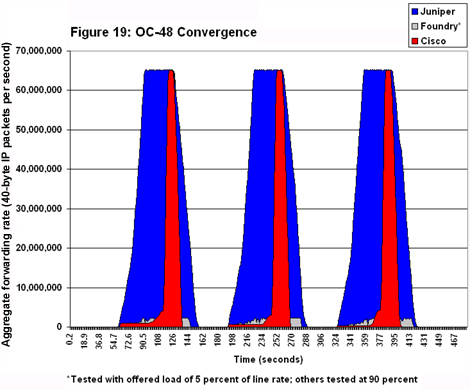 Although the 12416 didn’t converge as fast as the M160, it did eventually reach the same maximum forwarding rate. Convergence times are dependent in part on device memory, and Cisco has said it will be adding much more RAM to the 12416. That’s a relatively simple and cheap fix.
Foundry, unfortunately, couldn’t get out of the basement (to drive the architectural metaphor into the ground).
The Netirons were unable to forward more than a few thousand packets per second when we offered traffic at 90 percent of line rate. Even when we ratcheted the offered load down to 25 percent and then 13 percent, the routers dropped nearly all offered packets.
Foundry achieved its best forwarding rate when we used an offered load of just 5 percent of line rate. As with the flapping tests, Foundry reran the testinternally with fixed firmware and achieved very good results. However,these numbers were not independently verified.
Juniper once again delivered very impressive convergence times and forwarding rates on the OC192 testbed (see Figure 20). The M160s didn�’t converge quite as fast as in the OC48 tests, evidenced by a gentler slope as forwarding rates rose and then fell. Forwarding rates reached 260 million pps and remained there during all three event cycles.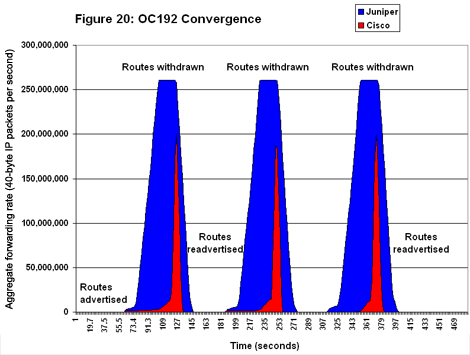 Cisco’s 12416 didn’t fare as well at OC192 as it did at OC48. Convergence took longer to occur, as shown by the narrowing columns for forwarding rate. And Cisco’s forwarding rate topped out at around 201 million pps.
We don’t think that Cisco has a horsepower problem; after all, this is the same card that produced line-rate throughput with short packets over MPLS. A more likely explanation is that Cisco’s IP routing code isn’t as well optimized for short packets as is Juniper’s. Remember: Cisco’s throughput in the OC192 baselines was 52 percent for 40-byte packets over IP, compared with 92.2 percent for Juniper.
We should also note that Cisco gave us a software patch for the flapping and convergence tests. Here again, the vendor told us the new code will be rolled into IOS release 12.0(15)SX.
We built our filtering test the same way we built everything else on the testbed — big. Our goal was to find out if screening traffic degrades router performance.
We used “allow” and “deny” filters, both alone and in combination, on ingress and egress interfaces. And we didn’t filter on just a handful of streams. Rather, we required vendors to develop filters covering 50 percent of the 200,000+ entries in our routing tables. (This didn’t necessarily require some 100,000 unique filters, though; it was possible to define filters for the OC192 testbed with fewer than 900 rules.)
Once the filters were in place, we ran the baseline tests again and noted any increase in packet loss or latency.
The biggest surprise came before we passed a single packet, whenCisco informed us that the 12416's OC48 and OC192 interfaces don't yetsupport filtering. Virtually every other switch and router interface inCisco’s product line does support filters, called access control lists(ACLs) in Cisco-speak. The vendor says the new OC48 and OC192 cards will getthe ACL treatment, but it didn't name a release date.
MIA filters may not be a showstopper for all customers. Some network designers say the place to screen packets is at the edge, not in the core. Others use filters on every switch or router, typically to ensure security or quality of service (QOS).
Juniper’s M160 turned in letter-perfect results on the OC48 testbed (see Figure 21). With an allow filter applied, the M160’s forwarding rate was exactly 100 percent of the baseline results, as it should be. With a deny filter applied, the M160’s forwarding rate was exactly 50.0 percent of the baseline — again, just the result we were looking for.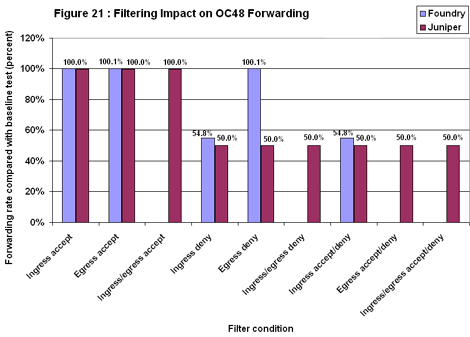 Foundry’s Netiron did reasonably well, with two exceptions. In the egress deny routine, the device allowed all traffic through. This was probably the result of a configuration error. With allow and deny filters applied on ingress, Netiron’s forwarding rate was 4 percent above the target.
We also examined the impact filters might have on OC48 latency (see Figure 22). Here again, Juniper’s results were perfect. In every case, latency was the same 15 microseconds we recorded in the baseline tests.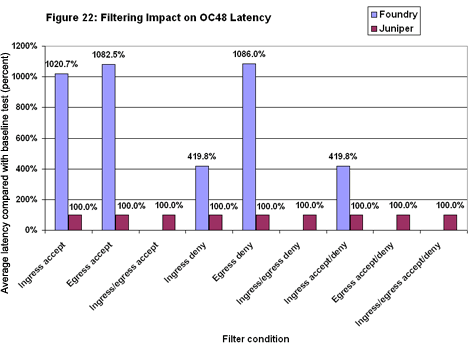 Foundry wasn’t as fortunate. With filters applied, Netiron added from four to 11 times as much delay as it did in the baselines. Clearly, there is a very substantial latency cost associated with filtering.
Before we began filtering on the OC192 testbed, Juniper expressed some concern that its filtering language syntax might exact a performance penalty. Given the larger number of interfaces and routes involved, the filter written in JunOS, the Unix-like Juniper operating system, comprised 150,000 lines of code. Even though JunOS compiles filters into binary form before using them, Juniper was concerned whether any piece of source code that large might impair performance.
The massive filter did have a noticeable impact, with forwarding rates dropping as much as 20 percent below the expected total (see Figure 23). Juniper’s response, after careful review, was to say they were pleased the M160 did as well as it did, considering the cost of parsing through a 150,000-line filter.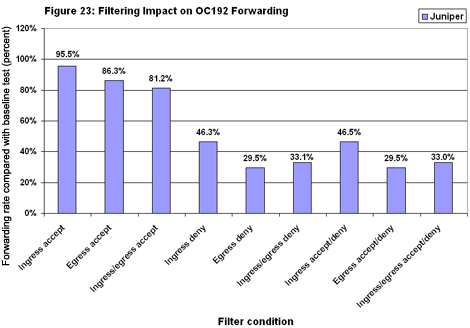 The big filter had much less impact on average latency (see Figure 24). Delay did rise in all cases, but the worst case was only by 12.5 percent. In absolute terms, the M160 posted latency measurements of roughly 30 microseconds in all OC192 filtering tests.
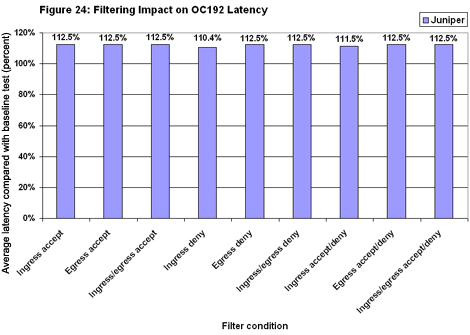 It’s also worth noting that the M160’s latency was very consistent across all test runs. Indeed, the Juniper jitter (to coin a phrase) never exceeded 3 microseconds. In most tests, latency varied by mere nanoseconds.
QOS is one of those acronyms service providers love to toss around. Little wonder: They get to charge a premium price by guaranteeing that given traffic classes — a group of mission-critical order-processing apps, for example — get preferential treatment when Internet congestion strikes.
In fact, many operators see QOS as their best hope for remaining (or, more likely, becoming) profitable.
What providers don’t tell customers is that QOS works exactly opposite to the way they’ve described it. It’s up to the boxes to treat some traffic types worse than others.
To see how badly these core routers could treat traffic, we asked vendors to define three service levels: gold, silver, and bronze. We then offered 40-byte IP packets as in the baseline tests, with two key exceptions. First, to create congestion, we physically removed two of the core interfaces, which overloaded the remaining core interfaces by 150 percent. Second, we used the IP precedence field in the packet headers to identify traffic classes.
We also asked vendors to configure their routers to deliver traffic in a ratio of 70:20:5 for gold:silver:bronze. Since we offered equal amounts of each traffic class on input, something would have to give.
Even with congestion, there was enough bandwidth in the core to forward all of the gold traffic with zero packet loss. To maintain the 70:20:5 ratio, the routers would have to drop substantial amounts of silver and bronze traffic. Thus, we were really looking at two metrics: forwarding rates and ratios of forwarded traffic.
Only Cisco and Juniper participated; time constraints prevented us from testing Foundry or Charlotte’s Networks.
On the OC48 testbed, Cisco’s 12416 achieved higher forwarding rates than Juniper’s M160 for all traffic classes (see Figure 25). Although neither vendor junked any gold packets, Cisco’s hit a higher rate because it started from a higher level. Remember that in the baselines the 12416 exhibited line-rate throughput, while the M160 peaked at 99.8 percent with 40-byte IP packets. They differ here by the same proportion.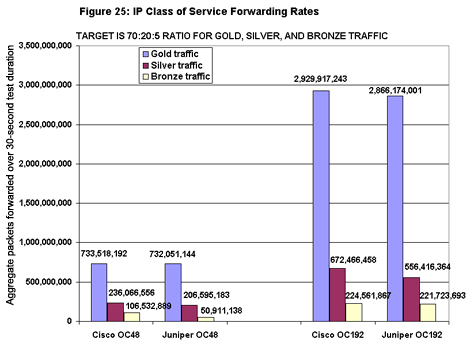 Cisco’s 12416 again achieved higher forwarding rates on the OC192 test bed. But this time both vendors dropped some gold packets: Cisco’s packet loss was 0.1 percent; Juniper’s, 2.3 percent. Cisco did the best job of protecting high-priority traffic on both testbeds.
We didn’t only look at gold traffic. We also watched to see how closely the boxes came to delivering all traffic in our desired 70:20:5 ratio.
That resulted in a split decision (see Figure 26). In the OC48 tests Juniper did a far better job, missing the 70:20:5 ratio by only a few hundredths of a point. Cisco wasn’t too far behind with bronze traffic, but it dropped too many silver packets.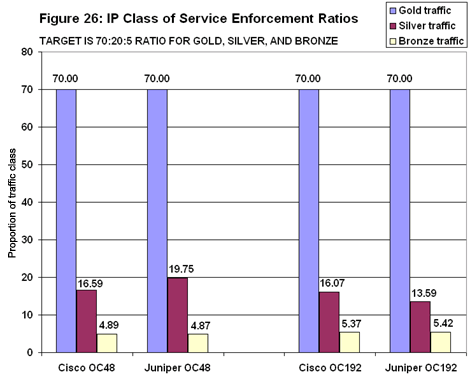 Cisco came closest to hitting the target ratios in the OC192 tests. The silver traffic again determined the outcome, with Cisco forwarding in a ratio of 70:16:5, compared with Juniper’s 70:14:5.
This test taught us something significant: Fine-grained traffic tuning may not be appropriate for production networks. No router on the market has knobs that give users pinpoint control over the exact percentages of each traffic class (at least, there are no such products that work). Both vendors spent hours changing buffer depths to try to get as close as possible to our target rates and ratios. Given enough time, both could probably have hit the test targets dead on — with the unvarying traffic we generated.
On production networks, where traffic patterns may change thousands of times a second, classification remains an inexact science.
You May Also Like
